

Fed Chairman Jerome Powell warned that the bank will keep hiking rates at a sharp clip, even risking pressure on economic growth and the labor market, as it struggles to rein in runaway inflation.
The hawkish comments cemented expectations that U.S. interest rates will end the year well above 4% – their highest level in over 14 years. However, the central bank also intends to keep rates higher for longer, with cuts beginning only in 2024.
U.S. Dollar Index (USDX)
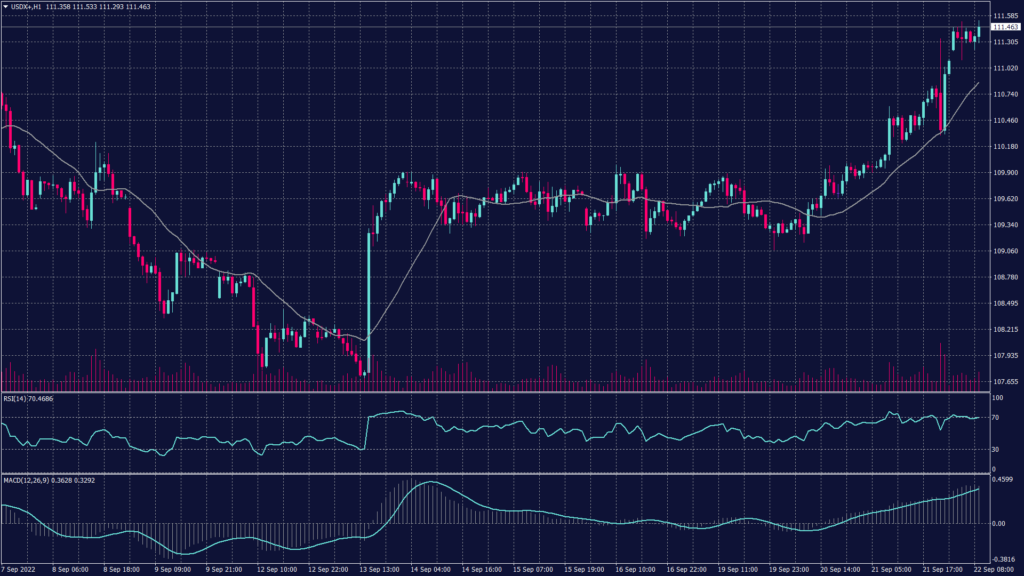
The U.S. dollar jumped to a new 20-year high against a basket of currencies after the Federal Reserve hit a more hawkish than expected tone. The dollar index rose 1% to 111.47to record its highest level since June 2002. Meanwhile, 10-year U.S. Treasury yields surged to an 11-year high.
The index gained further momentum on both the daily and hourly charts, which built higher support. The daily chart shows support at 109.90 and 110.50 confirmed by the readings of the moving averages and MACD. Meanwhile, the hourly chart shows additional support levels between the current levels and the daily levels at 111.30 and 111.05.
Pivot Point: 111.30
| SUPPORT | RESISTANCE |
| 111.05 | 112.20 |
| 110.85 | 113.00 |
| 110.65 | 113.20 |
Euro (EURUSD)
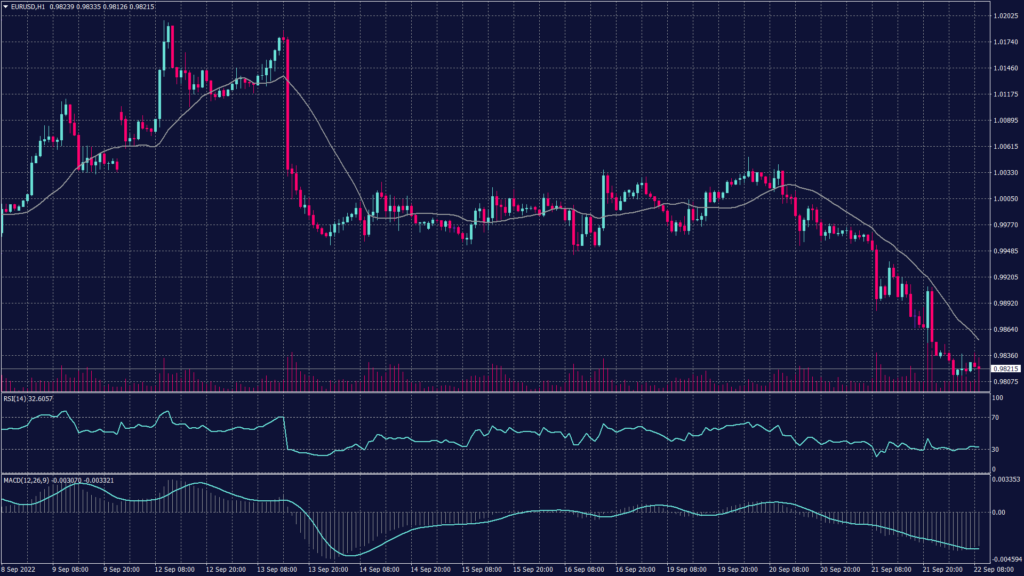
The European economic data schedule was mostly empty, but the action was on the other side of the pair. The hawkish tonality from the Fed pushed the greenback to historic levels which led its major peer to fall further to its lowest levels in 20 years.
The pair remains negatively trending towards new lows despite the light support it found at 0.9810 and the bounce to 0.9840 on the hourly chart. Meanwhile, the daily chart is showing heavy pressure below the parity levels and confirms the downtrend towards 0.9750.
Pivot Point: 0.9850
| SUPPORT | RESISTANCE |
| 0.9750 | 0.9860 |
| 0.9710 | 0.9890 |
| 0.9630 | 0.9910 |
Spot Gold (XAUUSD)
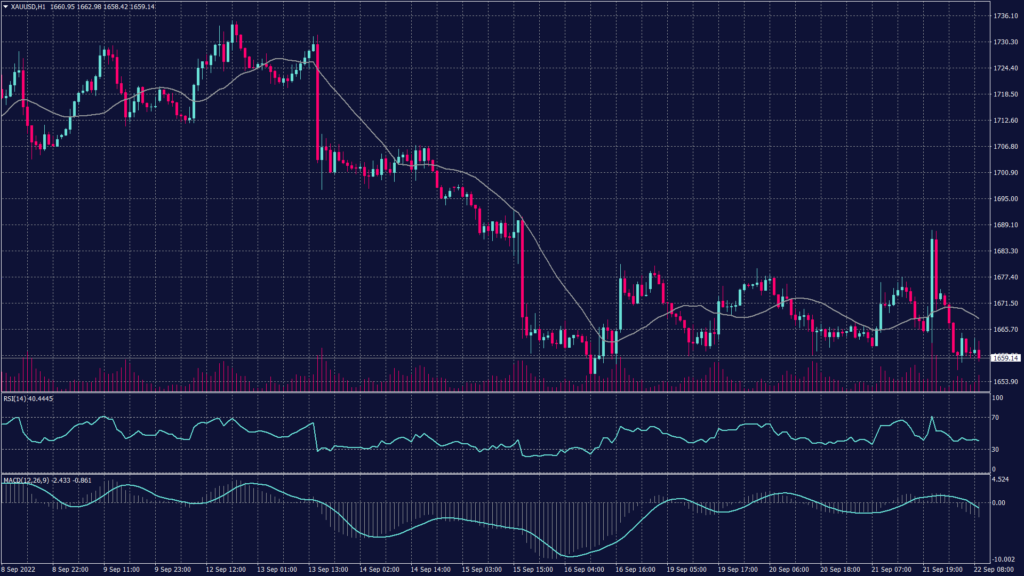
Gold prices conceded to recent gains after an interest rate hike and a hawkish message from the Federal Reserve. Bullion prices initially showed some resilience after the Fed’s decision, bouncing from over two-year lows as investors saw the metal as heavily oversold. Spot gold fell 0.3% to $1,669.56 an ounce, while gold futures fell slightly to $1,674.45 an ounce. Both instruments rose around 0.5% on Wednesday.
Technically, the precious metal remains under selling pressure below $1,665 per ounce on the hourly chart. However, technical indicators show a possibility of fluctuation and a slight rebound to 1,665 during the European session.
Pivot Point: 1,663
| SUPPORT | RESISTANCE |
| 1,659 | 1,670 |
| 1,654 | 1,675 |
| 1,625 | 1,678 |
West Texas Crude (USOUSD)
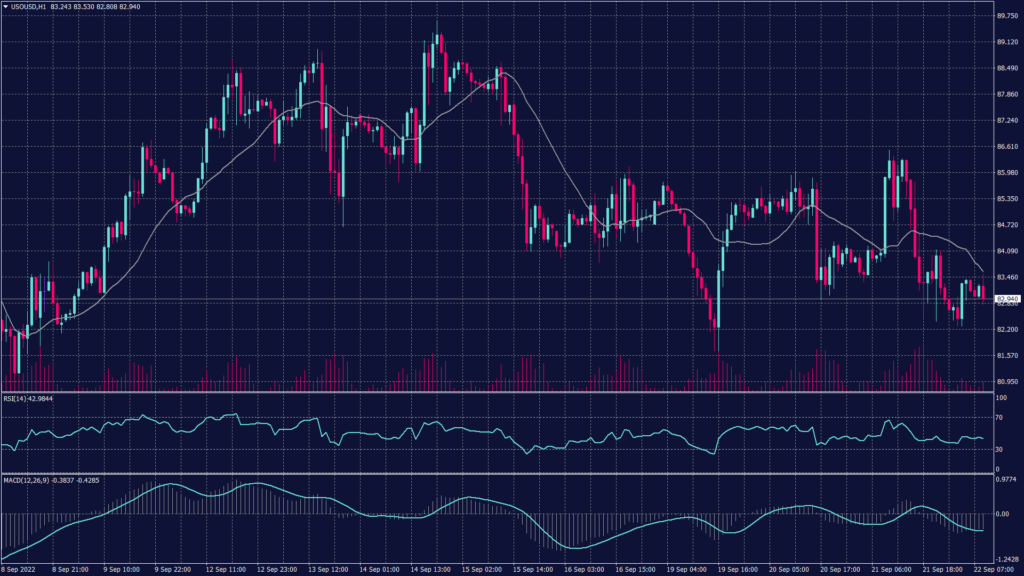
Oil rebounded on Thursday after sliding 1% in the previous session as concerns over tight supplies heading into winter eclipsed fears of a global recession. On the supply side, U.S. crude inventories rose by 1.1 million barrels in the week to September 16 to 430.8 million barrels, smaller than analysts’ expectations in a Reuters poll for a 2.2 million-barrel rise. Brent crude futures rose 0.6%, to $90.33 per barrel while WTI rose to $83.39.
WTI is moving in a slow fashion that might lead to a horizontal trend below $85 per barrel. However, technical indicators show neutral signals, but price action shows a tendency for negative movement.
Pivot Point: 83.50
| SUPPORT | RESISTANCE |
| 82.20 | 85.70 |
| 81.00 | 87.25 |
| 80.70 | 88.75 |
