

U.S. Dollar Index (USDX)
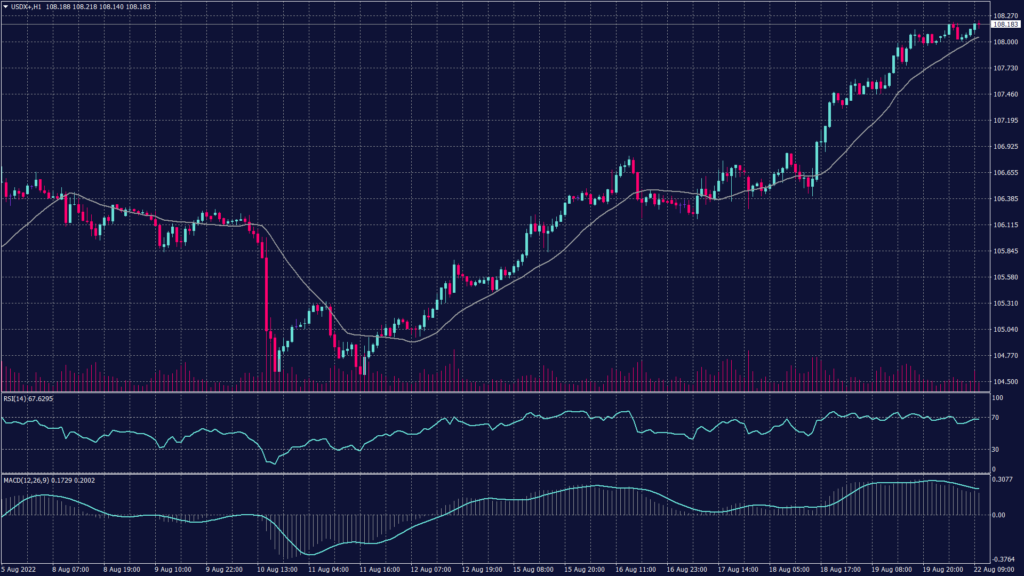
The U.S. dollar index hit a fresh five-week high on Monday after another Federal Reserve official flagged the likelihood of continued aggressive monetary tightening ahead of the central bank’s key Jackson Hole symposium this week. The index edged up to 108.26 for the first time since July 15 and was last up 0.074% at 108.23.
The dollar index remains positive and holding the momentum on the daily chart towards 109 from the current level at 108.30. Meanwhile, the technical indicators show a continuation of the uptrend. However, the hourly chart shows a possibility of fluctuation but remains positive overall.
PIVOT POINT: 108.30
| SUPPORT | RESISTANCE |
| 108.10 | 109.00 |
| 107.80 | 109.10 |
| 107.60 | 109.15 |
Chinese Yuan (USDCNH)
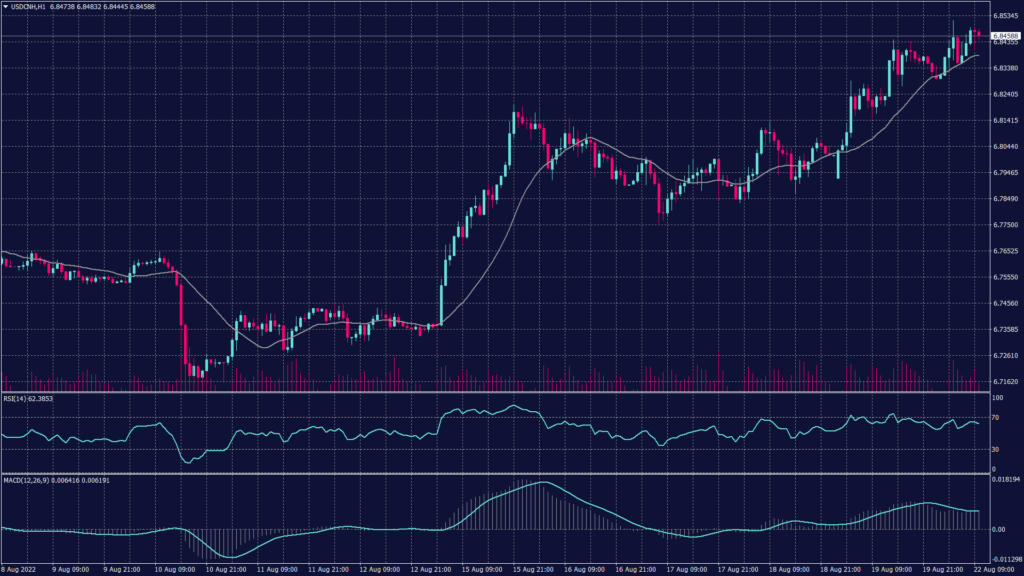
The Chinese yuan weakened to a near two-year low on Monday after the People’s Bank cut lending rates for the second time in two weeks.
The yuan fell 0.1% to 6.8273 to the dollar, its weakest level since September 2020, after the People’s Bank of China (PBoC) lowered its benchmark rates for a second consecutive week. The decision comes as the bank struggles to stimulate the economy amid headwinds from COVID lockdowns, a debt-saddled property market and a brewing energy crisis.
The pair remains heading upwards after breaking the resistance at 6.8240 on the daily chart. Meanwhile, the hourly chart shows resistance at 6.8560 which may cause fluctuation before the continuation of the uptrend.
PIVOT POINT: 6.8550
| SUPPORT | RESISTANCE |
| 6.8520 | 6.8560 |
| 6.8425 | 6.8620 |
| 6.8325 | 6.8800 |
Spot Gold (XAUUSD)
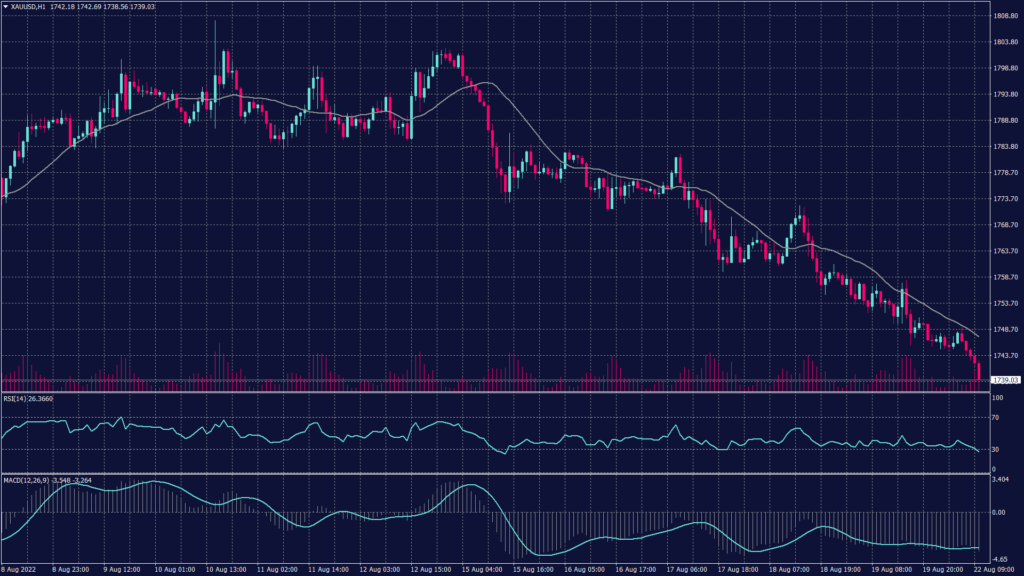
Gold prices slipped further on Monday as uncertainty over the Federal Reserve’s path of monetary tightening persisted, while copper prices fell on more manufacturing troubles in major importer China.
Spot gold prices fell 0.1% to $1,745.46 an ounce, while gold futures dropped 0.2% to $1,759.90 an ounce. Prices had retreated last week as hawkish comments from several Fed officials suggested that the central bank was likely to commit to raising interest rates at a sharp clip to combat overheated inflation.
Spot gold remains negative on both the daily and hourly chart after breaking below the support at 1,740 which indicates a continuation towards $1,720 per ounce. However, the first support on the hourly chart is at $1,723 per ounce.
PIVOT POINT: 1,735
| SUPPORT | RESISTANCE |
| 1,723 | 1,740 |
| 1,715 | 1,748 |
| 1,706 | 1,756 |
West Texas Crude (USOUSD)
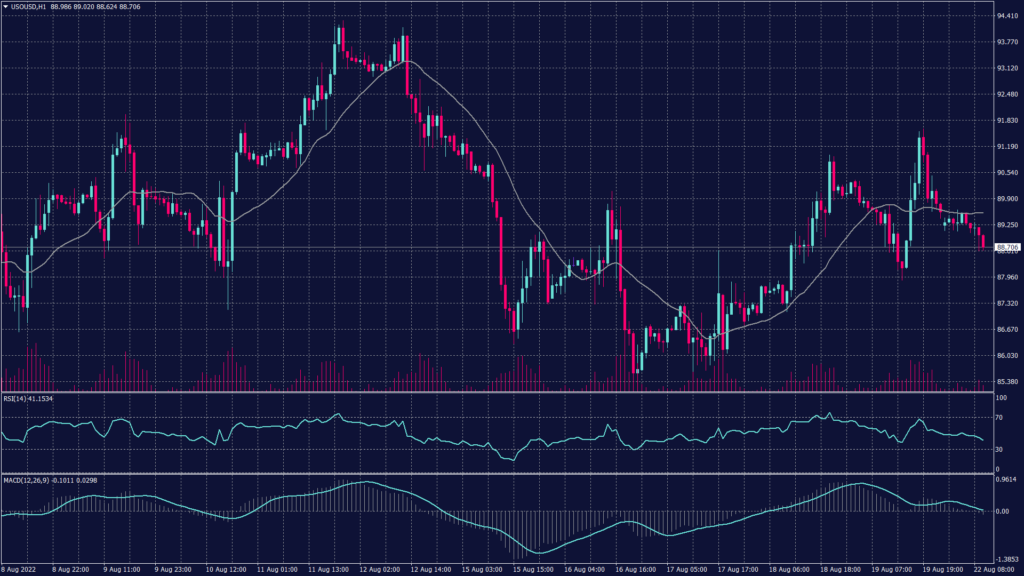
Oil prices fell on Monday, ending three days of gains, on fears aggressive U.S. interest rate hikes may lead to a global economic slowdown and dent fuel demand.
Brent declined 1.2% to $95.55 a barrel, with concerns over slowing demand in China because of a power crunch in some areas also weighing on prices. WTI crude was down 1.2% to $89.65 per barrel. The more active October contract was at $89.29 down $1.15.
WTI lost the support after breaking the $89 per barrel while heading towards $87.65 per barrel. Meanwhile, technical indicators show a high possibility to reach 86.10 in the short term.
PIVOT POINT: 88.40
| SUPPORT | RESISTANCE |
| 88.15 | 89.10 |
| 87.60 | 89.80 |
| 87.25 | 90.60 |
