

U.S. Dollar Index (USDX)
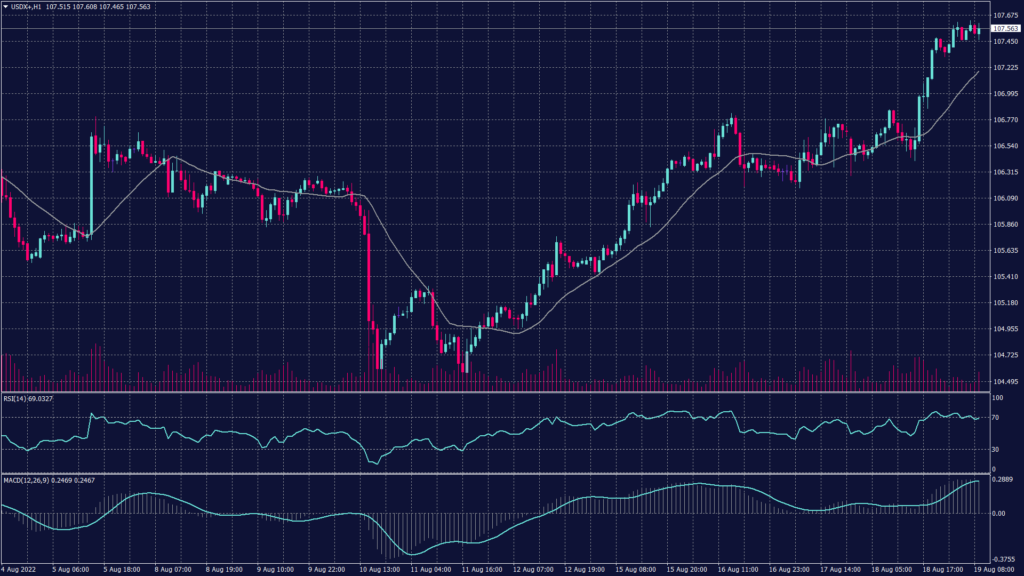
The U.S. dollar hit a one-month high versus its major peers this morning as Fed officials continued to mention the need for further interest rate hikes. Meanwhile, the dollar index rose 0.14% to 107.63, after touching 107.72 which is its highest since July 18. The index is on track for a 1.86% rally this week, which would be its best weekly performance since June 12.
The U.S. dollar index kept restored the momentum on the daily chart after bouncing from 104.50 on August 11 and breaking above the resistance at 106.40. Additionally, the moving average for 20 days also confirms a support at 106.10 on the daily chart with strong buying activities shown in the RSI indicator.
Meanwhile, the hourly chart shows a light resistance at 107.60 that reflects on the RSI and MACD readings. However, as long as the larger time frames are confirming the continuation of the uptrend, the hourly chart indications might be speculative in use.
PIVOT POINT: 107.60
| SUPPORT | RESISTANCE |
| 107.35 | 107.90 |
| 107.10 | 108.10 |
| 106.60 | 108.40 |
Euro (EURUSD)
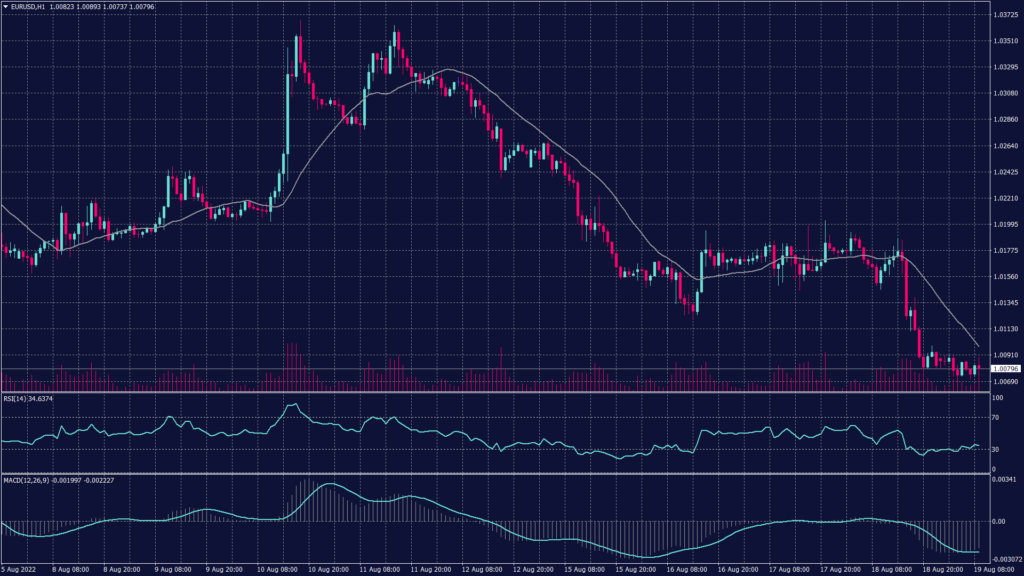
The euro is close to recording a decline of 1.73% since last Friday, which would be its worst week since July 8. Furthermore, the European currency failed to get a lift from renewed inflation fears putting pressure on regional central banks to keep the strict policy, with investors worrying about the risk of recession.
The common currency pair lost the battel against the bearish pressure and started a free fall from the previous support range between 1.0175 and 1.0185 falling to near parity levels this morning. The EURUSD pair traded at 1.0080 with a slight emotional support above 1:1 ration against the U.S. dollar that is expected to break unless the bearish pressure eased.
However, the hourly chart shows a high possibility to break below the parity levels towards 0.9980 and 0.9950. On the other side, RSI and MACD show a possibility of speculative fluctuations around the current levels.
PIVOT POINT: 1.0080
| SUPPORT | RESISTANCE |
| 1.0060 | 1.0120 |
| 1.0030 | 1.0170 |
| 1.0000 | 1.0200 |
Spot Gold (XAUUSD)
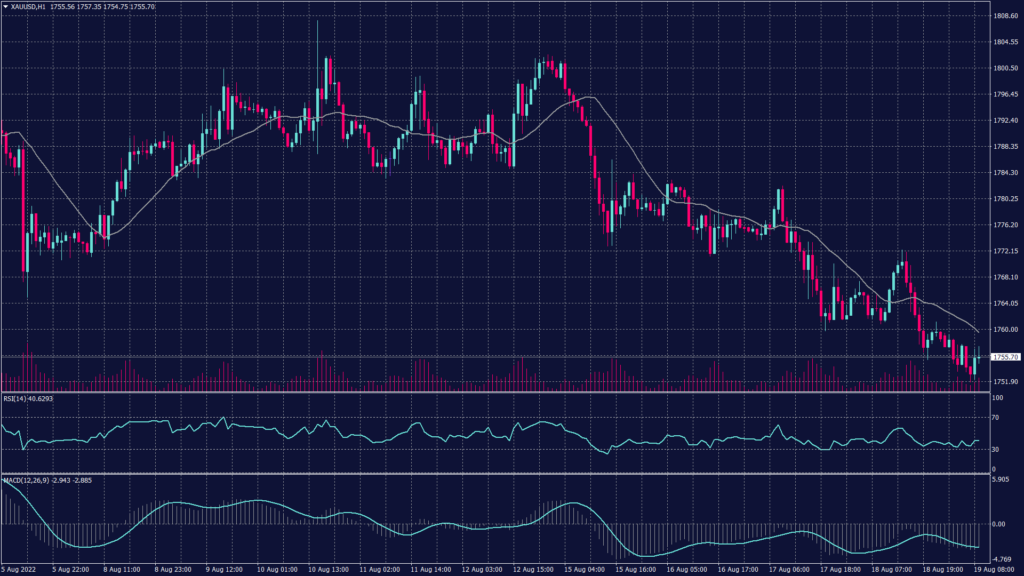
Gold prices fell slightly on Friday and were set to end the week lower as hawkish signals from the U.S. Federal Reserve on the path of U.S. interest rates drove up the dollar. Spot gold fell 0.1% to $1,756.59 an ounce, while gold futures dipped by a similar amount to $1,769.70. Experts expect both instruments to end the week with a 2.6% loss, having fallen for all five sessions.
Spot gold declined to the support levels at 1,750 and is showing a possibility of further decline towards 1,745 and 1,740. However, the daily chart shows a continuation to the downtrend targeting the lowest levels in a year at 1,675.
PIVOT POINT: 1,753
| SUPPORT | RESISTANCE |
| 1,750 | 1,770 |
| 1,745 | 1,785 |
| 1,740 | 1,800 |
West Texas Crude (USOUSD)
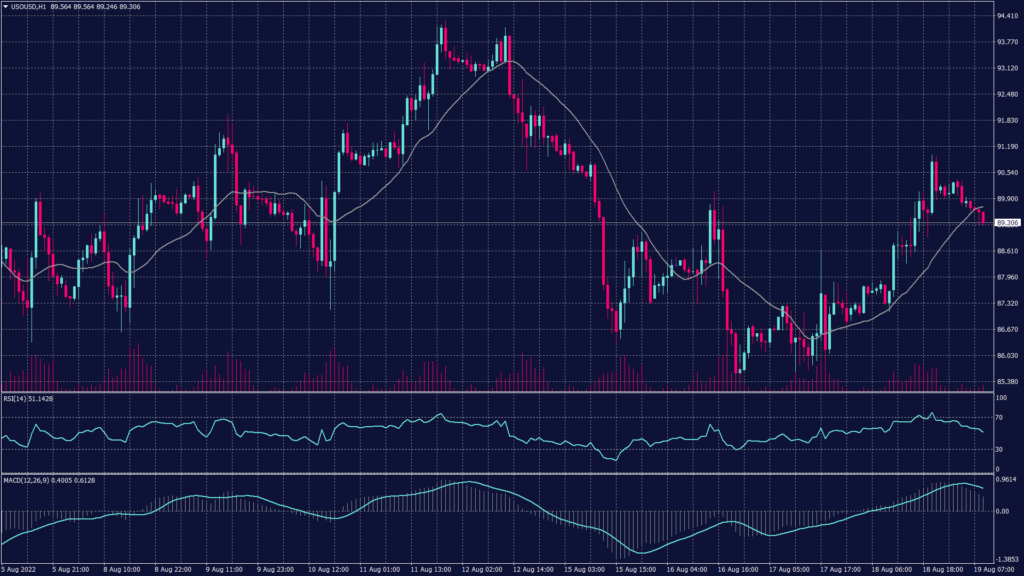
Oil prices dropped this morning after two days of gain, as market participants weighed worries about a global economic slowdown that could dampen fuel demand. Brent crude futures fell 0.4% to $96.23 a barrel after settling 3.1% higher on Thursday. Meanwhile, WTI crude was at $90.29 a barrel.
WTI found support at $87.40 per barrel on the hourly chart which can be considered a speculative area as long as the prices haven’t dropped below $86.50 per barrel. Meanwhile, the daily chart shows a continuation of the downtrend and a high possibility of breaking towards $82.90.
PIVOT POINT: 89.00
| SUPPORT | RESISTANCE |
| 88.70 | 91.55 |
| 87.60 | 94.00 |
| 86.50 | 97.50 |
