

U.S. Dollar Index (USDX)
The U.S. dollar index was volatile after data showed U.S. manufacturing activity slowed less than expected in July. Last week, the Fed raised the benchmark overnight interest rate by three-quarters of a percentage point. The move came on top of a 75 basis points hike last month and smaller moves in May and March, in an effort by the U.S. central bank to cool inflation.
Technically:
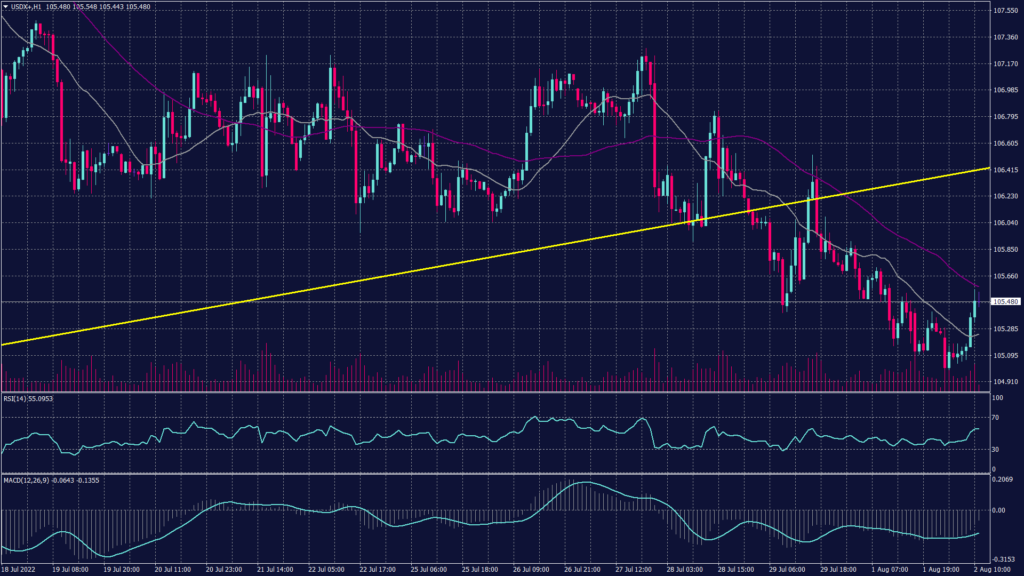
The U.S. dollar index continues the secondary downtrend after breaking below the upward channel at 106.20. On the hourly chart, the index remains negative despite the support at 105.40 and 104.60. Meanwhile, the daily chart shows a high possibility of continuation towards the strong support at 103.55, which will raise two scenarios.
In the first scenario, if the index bounced from 103.55 it will most likely continue the main trend upwards. In the other scenario, if the index broke below the previous bottom at 103.55 it will be confirming the change of direction.
Technical indicators show mixed signals as RSI is showing fluctuations between 104.60 and 105.40 while MACD show a continuation to the downside.
PIVOT POINT: 105.40
| SUPPORT | RESISTANCE |
| 105.20 | 105.55 |
| 104.90 | 105.90 |
| 104.60 | 106.20 |
Japanese Yen (USDJPY)
The Japanese Yen hit the strongest level since mid-June against the greenback on Monday as investors weighed the probability that the Federal Reserve will not raise interest rates as aggressively than expected. Also last week, the dollar crumbled against the yen, and two-year yields in the U.S. Treasury market also fell, after data showed the U.S. economy shrank for a second straight quarter.
Technically:
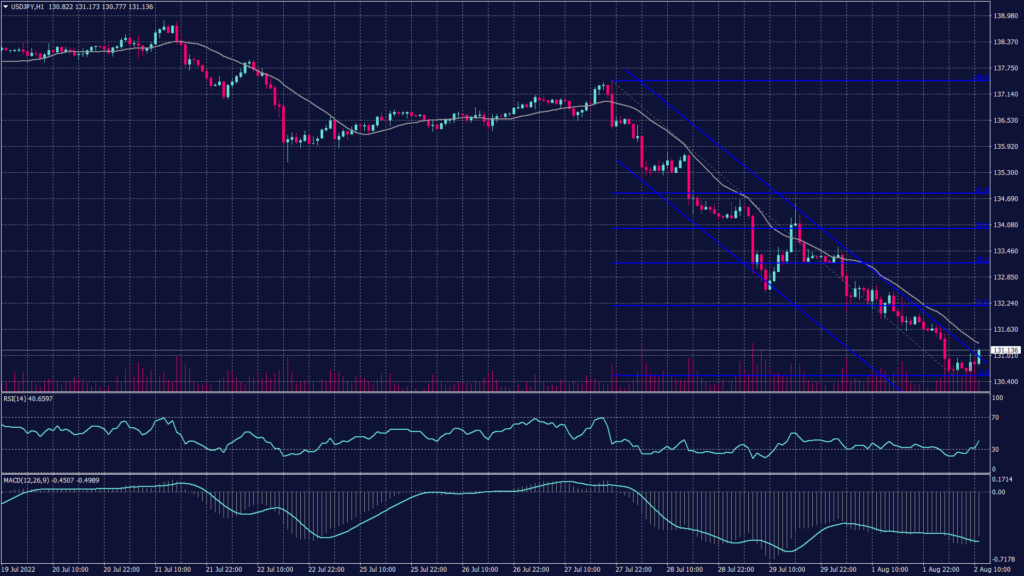
The hourly chart shows a continuation to the downtrend as the pair is committing to the regression channel shown in the chart above. Additionally, Fibonacci retracement signals support above 130 Yen per dollar. Meanwhile, the daily chart confirms the sharp continuation and signals a target at the previous support 126.60. Technical indicators confirm the hypothesis of continuation, and the moving averages remain diverging.
PIVOT POINT: 130.90
| SUPPORT | RESISTANCE |
| 133.55 | 131.50 |
| 129.85 | 132.10 |
| 126.60 | 132.60 |
Australian Dollar (AUDUSD)
The Reserve Bank of Australia raised its cash rate 50 basis points to 1.85% on Tuesday and signaled yet more hikes ahead. However, market participants expect RBA to continuing the aggressive tightening that many central banks have adopted to combat inflation, risking a global economic slowdown.
Technically:
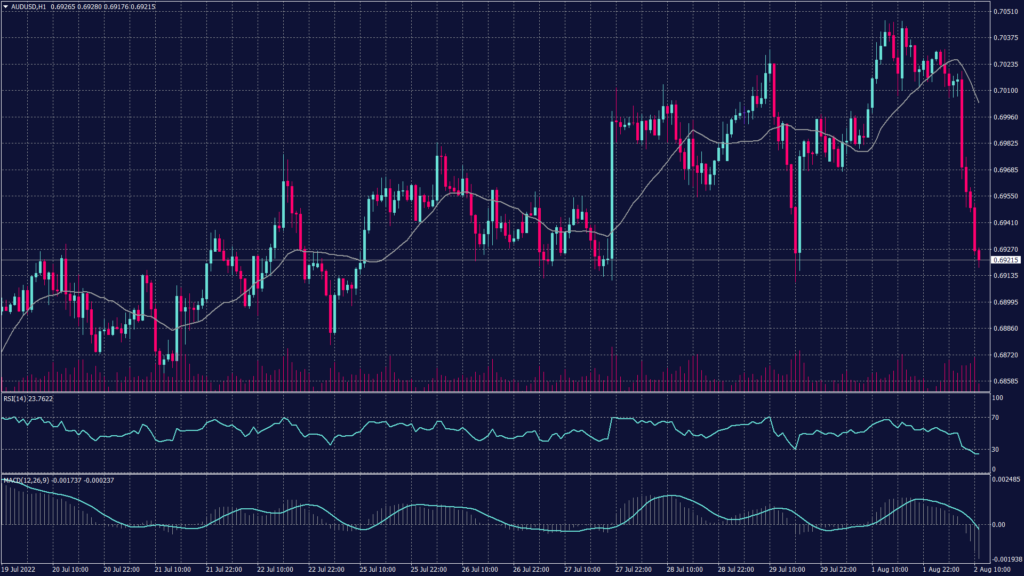
Aussie pair remains negative as signals further decline on both the daily and hourly chart. However, Fibonacci retracement shows support at 0.69260 and price action also confirms the support range above 0.69100. Market analysts see the level of 0.6900 as a critical level of which breaking it will most likely result in drop towards 0.68750.
PIVOT POINT: 0.69100
| SUPPORT | RESISTANCE |
| 0.68990 | 0.69730 |
| 0.68800 | 0.69960 |
| 0.68700 | 0.70200 |
Spot Gold (XAUUSD)
Gold prices rose on Tuesday as signs of weakening global economy triggered demand for the safe haven. Furthermore, weak U.S. GDP data had triggered safe haven buying into gold last week.
Spot gold prices rose nearly 0.4% to $1,778.59 an ounce- their highest level in nearly a month. Gold Futures expiring in December were trading up more than 0.4% and were close to breaking above $1,800.
Technically:
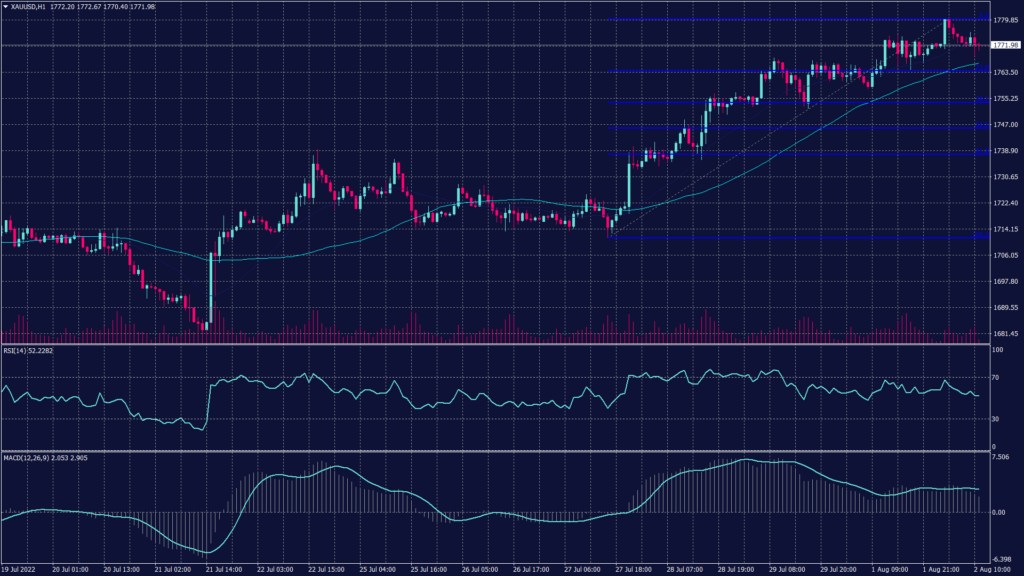
Gold prices continue to be positive on what looks like a secondary uptrend towards the major range at 1,800 and 1,825. On the hourly chart, the chart is facing a resistance at 1,779 which is confirmed by Fibonacci retracement readings.
PIVOT POINT: 1,774
| SUPPORT | RESISTANCE |
| 1,764 | 1,779 |
| 1,753 | 1,800 |
| 1,745 | 1,810 |
West Texas Crude (USOUSD)
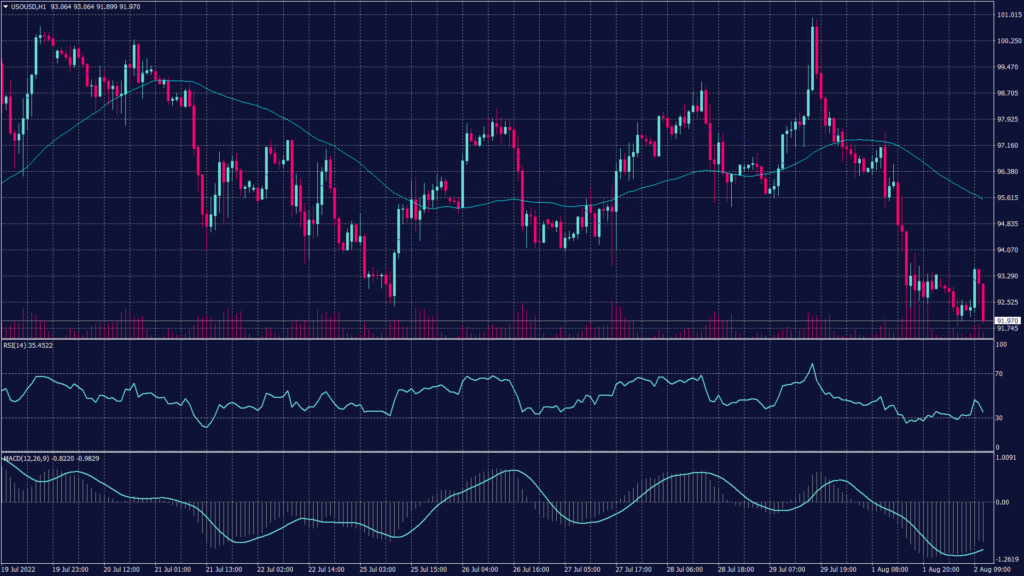
Oil prices dropped again on Tuesday as investors show an interest in a bleak outlook for fuel demand with data pointing to a global manufacturing downturn just as major crude producers meet this week to determine whether to increase supply.
Brent crude futures fell 0.8% to $99.26 a barrel, while WTI crude futures eased 0.7% to $93.22 a barrel. The slide came after Brent futures slumped on Monday to a session low of $99.09 a barrel, their lowest since July 15. The U.S. crude benchmark dropped to as low as $92.42 a barrel, its weakest since July 14.
Recessionary concerns were heightened on Monday as surveys from the United States, Europe and Asia showed that factories struggled for momentum in July. Flagging global demand and China’s strict COVID-19 restrictions slowed production. The price drops also come as market participants await the outcome of OPEC+ meeting to decide on September output.
Technically:
WTI chart show a high possibility of the continuation to the downtrend but is trading at an important support near $92 per barrel. Meanwhile, the hourly chart shows a fluctuation inside the range between $92 and $93.50 a barrel unless the prices penetrated above $93.90.
PIVOT POINT: 92.40
| SUPPORT | RESISTANCE |
| 92.00 | 93.50 |
| 91.20 | 95.30 |
| 89.80 | 96.30 |
