

U.S. Dollar Index (USDX)
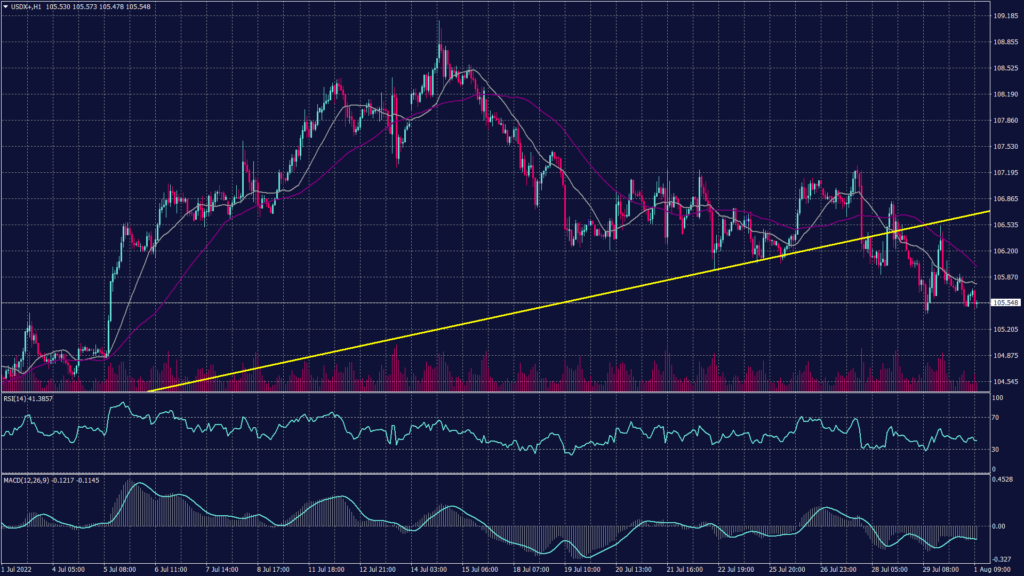
The dollar sank on Monday as markets continued to wager that the Federal Reserve has less tightening to do with the U.S. economy at risk of recession. Meanwhile, the dollar index edged down 0.18% to 105.80, slipping back toward Friday’s low of 105.53, a level not seen since July 5.
Technically, the U.S. dollar index broke below the uptrend line at 106.00 on the daily chart but it is expected to bounce back upwards unless it broke below the support at 103.65. Meanwhile, the index is forming a support at 105.50. Technical indicators on the daily chart signal a high probability of further decline towards the range of 105.10 and 104.50.
PIVOT POINT: 105.60
| SUPPORT | RESISTANCE |
| 105.50 | 105.85 |
| 105.20 | 105.90 |
| 104.90 | 106.20 |
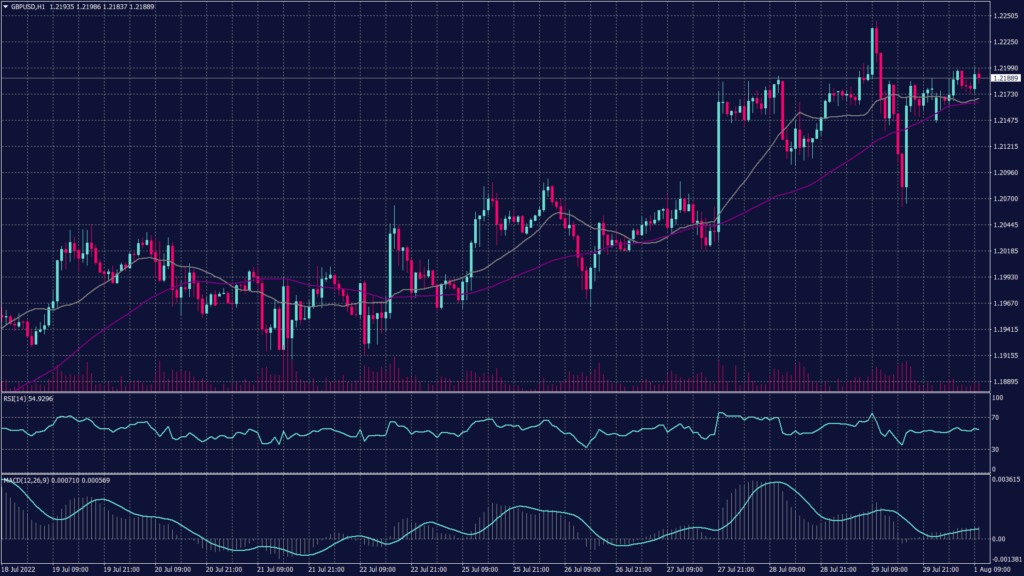
Sterling Pound (GBPUSD)
The British public’s expectations for inflation fell again in July, a survey showed on Monday, potentially adding to the case for the Bank of England (BoE) to increase interest rates by only 25 bp later this week.
The BoE’s Monetary Policy Committee (MPC), which has raised interest rates steadily since December to fight an inflation rate now above 9%, has said it is ready to act forcefully if needed to stop the recent price surge from becoming embedded.
Sterling was flat at $1.2183, after hitting the highest since June 28 at $1.2245 on Friday. Markets are laying 67% odds for a half-point rate hike by the Bank of England on Thursday, compared to a 33% probability of a quarter-point increase.
The pair remains inside the downward channel for the on the daily chart targeting levels near 1.1760. Meanwhile, the hourly chart shows an upward trend targeting 1.23215 before it hits the critical resistance. Technical indicators confirm the corrective movement and indicate a possible decline.
PIVOT POINT: 1.21950
| SUPPORT | RESISTANCE |
| 1.21370 | 1.22275 |
| 1.20425 | 1.23165 |
| 1.19480 | 1.24200 |
Spot Gold (XAUUSD)
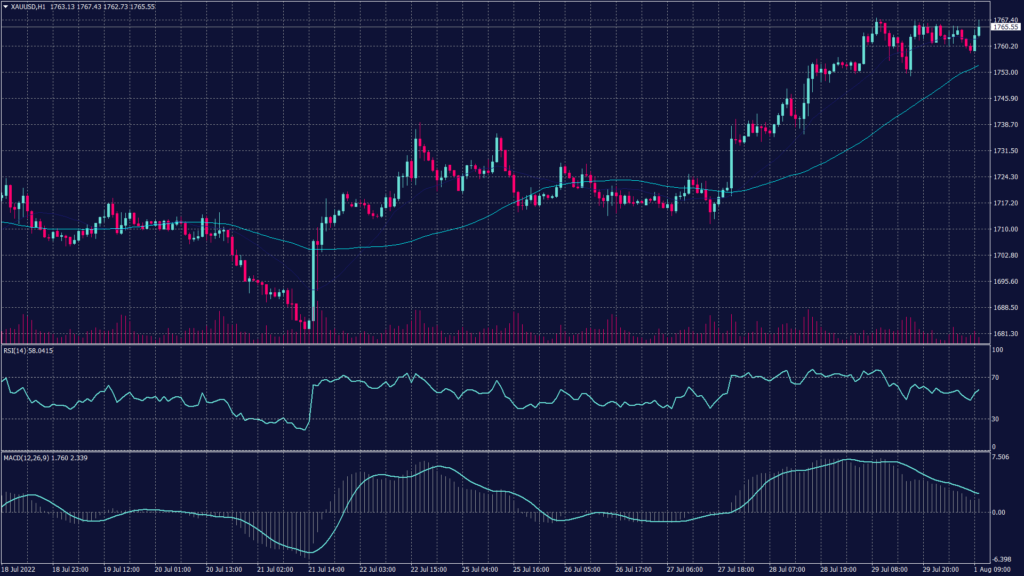
The precious metal traded red at $1,764 during the first session of the month following two weeks of gains. However, the daily chart shows a possibility of rebounding towards $1,789 an ounce.
Although gold prices hit the highest since July 6, the positive trend hit the resistance below 1,768 and it might slow if not reverse. However, if the uptrend continued the prices are unlikely to penetrate 1,789.
Meanwhile, the hourly chart remains optimistic despite technical indicators reaching theoretical peaks. However, the gold chart confirms the strong resistance below 1,768 which might push prices back.
PIVOT POINT: 1,763
| SUPPORT | RESISTANCE |
| 1,761 | 1,768 |
| 1,753 | 1,774 |
| 1,745 | 1,789 |
West Texas Crude (USOUSD)
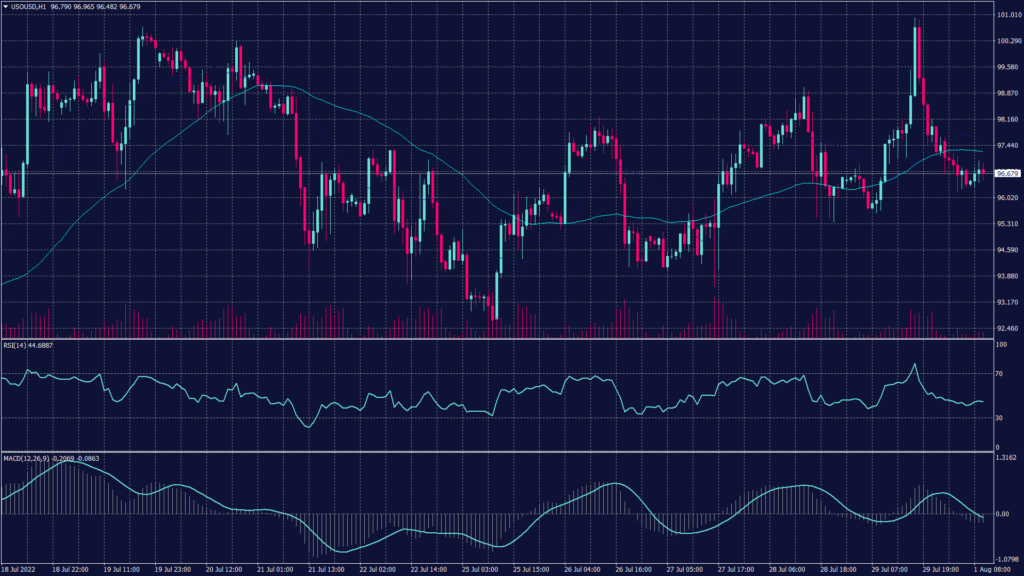
Oil prices dropped on Monday, as weak manufacturing data from China and Japan for July weighed on the outlook for demand, while investors braced for this week’s meeting of officials from OPEC and other top producers on supply adjustments.
Meanwhile, U.S. oil production continued to climb as the rig count rose by 11 in July, increasing for a record 23rd month in a row, data from Baker Hughes showed. Brent crude futures were down 82 cents, or 0.8%, at $103.15 a barrel. while U.S. West Texas Intermediate crude was at $97.44 a barrel down 1.2%.
WTI is expected to fall sharp from $97.50 towards $93.40 a barrel during the day, while technical indicators also confirm.
PIVOT POINT: 96.25
| SUPPORT | RESISTANCE |
| 95.70 | 96.60 |
| 95.10 | 97.70 |
| 93.60 | 98.90 |
