

U.S. Dollar Index (USDX)
The dollar index was down by 0.14% at 107.04 on Wednesday, as traders gear up for a crucial Federal Reserve policy decision scheduled for later in the day. Investors are waiting to see the extent the U.S. central bank will go to combat inflation, as concerns remain that aggressive Fed rate hikes will instead weigh on growth.
Policymakers are mulling over consumer prices running at 40-year highs, along with a recent batch of weak economic data. On Tuesday, U.S. consumer confidence tumbled to its lowest mark in almost a year and a half, while new home price growth and sales of new houses both slowed. Markets have largely priced in a 75-basis point increase, with only a small chance of a jumbo 100 basis point rise.
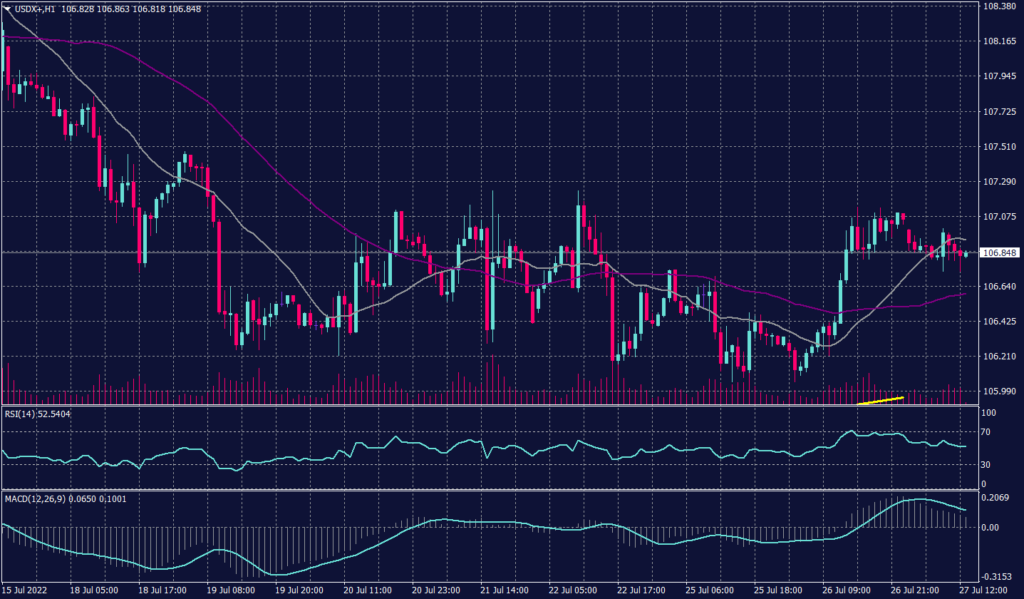
The U.S. dollar index traded slightly lower at 107 during the early sessions as expectations of the U.S. rate increase provided support. The U.S. Dollar index remained positive in all time frames, although it slightly slipped this morning. On the hourly chart, the index is hovering in a horizontal fashion building momentum above the support at 106.85.
Meanwhile, on the daily chart, the trendline shows a text-book pattern of an upward continuation. However, Technical indicators signal a slight retreat on the hourly and daily chart during the day before the continuation of the uptrend.
PIVOT POINT: 106.80
| SUPPORT | RESISTANCE |
| 106.50 | 107.00 |
| 106.40 | 107.40 |
| 106.20 | 107.70 |
Euro (EURUSD)
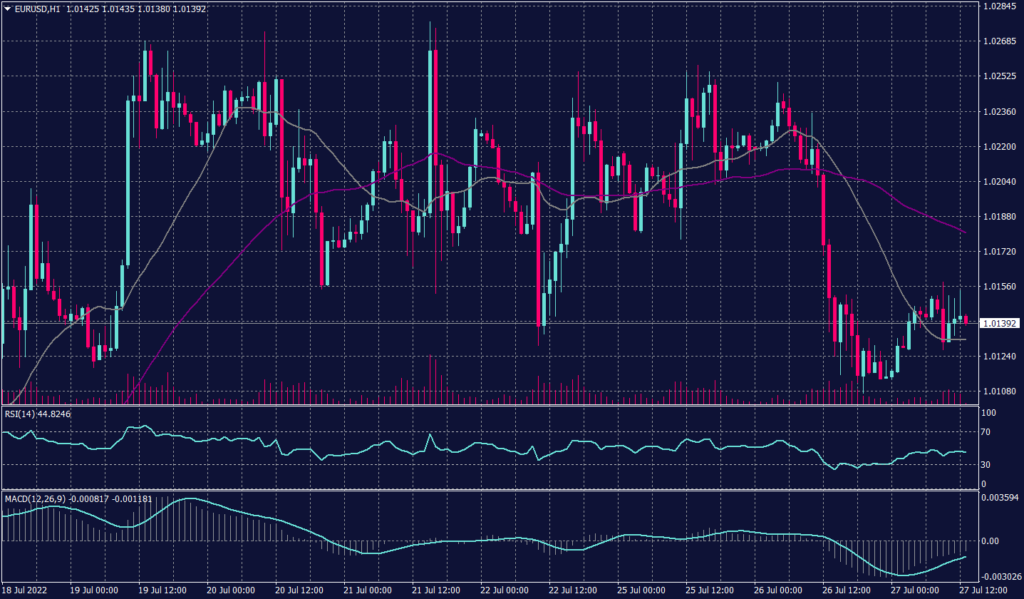
The euro recovered some ground versus the dollar after it declined by 1% overnight to $1.0108 – the sharpest fall since July 11. The common currency rose by 0.19% to $1.0137 in early morning European trading. Westward flows out of the key Nord Stream 1 pipeline dropped on Tuesday and are expected to fall further on Wednesday.
Meanwhile, technical indicators show mixed signals as MACD shows a possibility of breaking above the current resistance. However, RSI is moving at neutral levels while the moving averages indicate a tendency to decline.
PIVOT POINT: 1.01500
| SUPPORT | RESISTANCE |
| 1.0100 | 1.0270 |
| 0.9960 | 1.0350 |
| 0.9850 | 1.0470 |
Spot Gold (XAUUSD)
Gold was down 0.15% to $1,715.20 on Wednesday morning in Asia ahead of the policy decision from the U.S. Federal Reserve. Market participants expect the Fed to hike interest rates by another 75 basis points after its policy meeting on Wednesday. Additionally, some experts believe the hike will be 100 bp.
The International Monetary Fund warned that the world economy may soon be on the verge of an outright recession. Monetary tightening, Europe’s energy shortages over Russia’s invasion of Ukraine and China’s property sector, and COVID curbs remain the headwinds to the global economic rebound.
U.S. Conference Board (CB) Consumer Confidence dropped to 95.7, a near two-year low in July amid persistent worries about soaring inflation and higher rates.
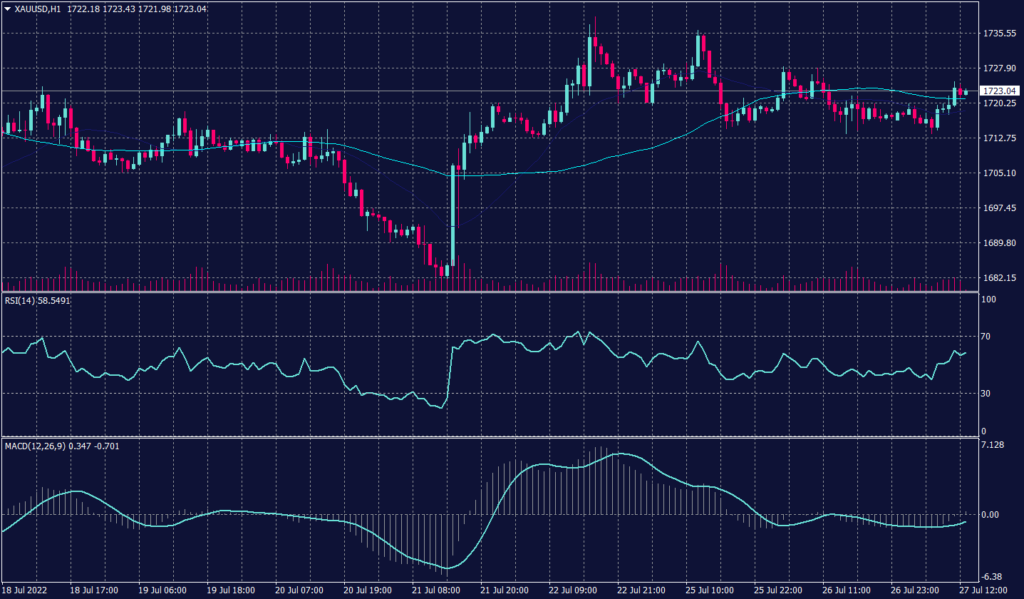
The daily gold chart shows a tendency for a decline, but it also shows support above $1,715. Meanwhile, the hourly chart shows smaller candles and a shorter range which indicates a possibility of an impulsive downwards movement. Technical indicators also confirm the possibility of the decline.
PIVOT POINT: 1,720
| SUPPORT | RESISTANCE |
| 1,715 | 1,726 |
| 1,710 | 1,733 |
| 1,700 | 1,740 |
West Texas Crude (USOUSD)
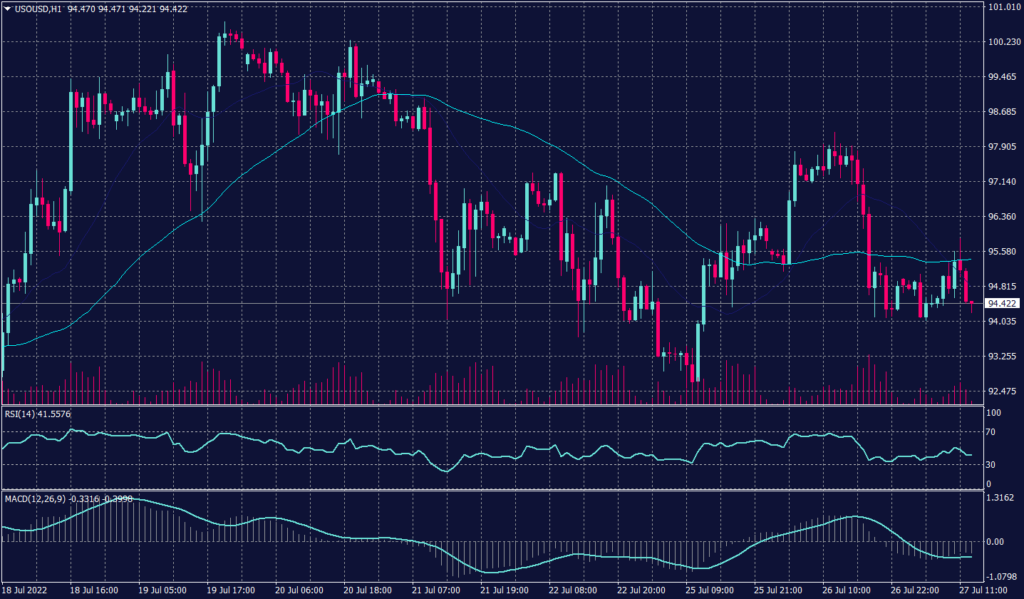
Crude oil rose by $1 a barrel on Wednesday as a report of lower inventories in the United States and cuts in Russian gas flows to Europe offset concern about weaker demand and a looming U.S. interest rate hike. Technically, WTI’s daily chart remains negative while technical indicators are indecisive. Meanwhile, moving averages for 20 and 55 days support the assumption of further decline.
PIVOT POINT: 95.00
| SUPPORT | RESISTANCE |
| 94.00 | 97.95 |
| 93.50 | 98.50 |
| 92.60 | 99.10 |
