

U.S. Dollar Index (USDX)
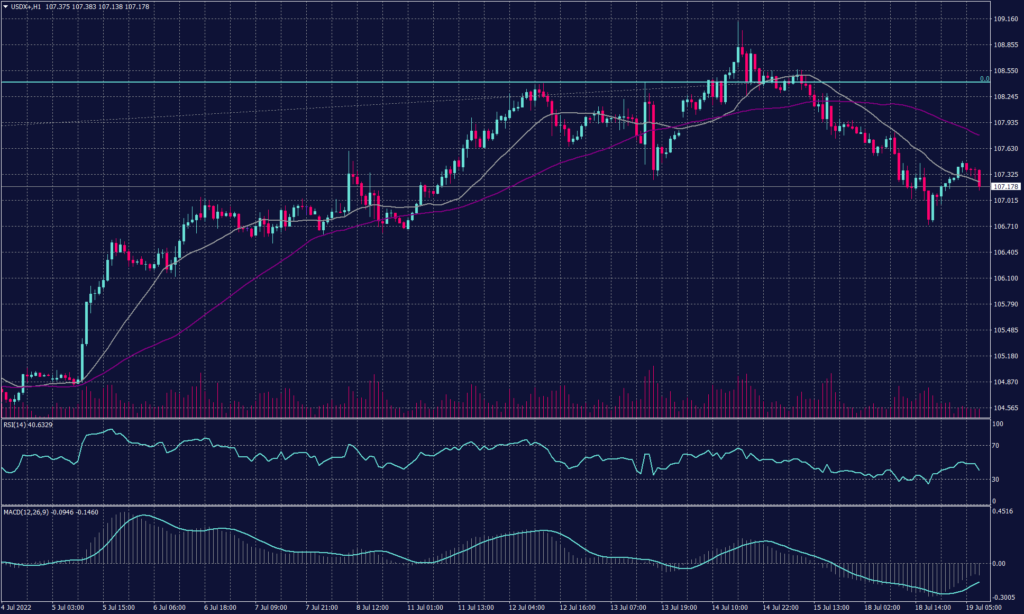
The dollar declined and hovered just above a one-week low as investors expect a 100 bp rate hike. The U.S. Dollar Index edged up 0.11% to 107.49. Data showed that U.S. inflation was at a four-decade high and continued to accelerate further. However, figures from last Friday showed an easing of consumer inflation expectations to the lowest in a year.
The U.S. dollar index was green early in the day but went back as market liquidity declines. The trading momentum also declined as fears of recession rise. The index traded in lower volume during the early session below the support at 107.20. If the index broke below 107 it is expected to reach 106.70.
On the hourly chart, technical indicators show a possibility of continuation to the downtrend as RSI is heading to 30 and MACD is curving away from the intersection. Meanwhile, the daily chart signals a slight decline just below 107 and then bounces above 108.20.
PIVOT POINT: 107.00
| SUPPORT | RESISTANCE |
| 106.70 | 107.20 |
| 106.60 | 107.40 |
| 106.40 | 107.75 |
Euro (EURUSD)
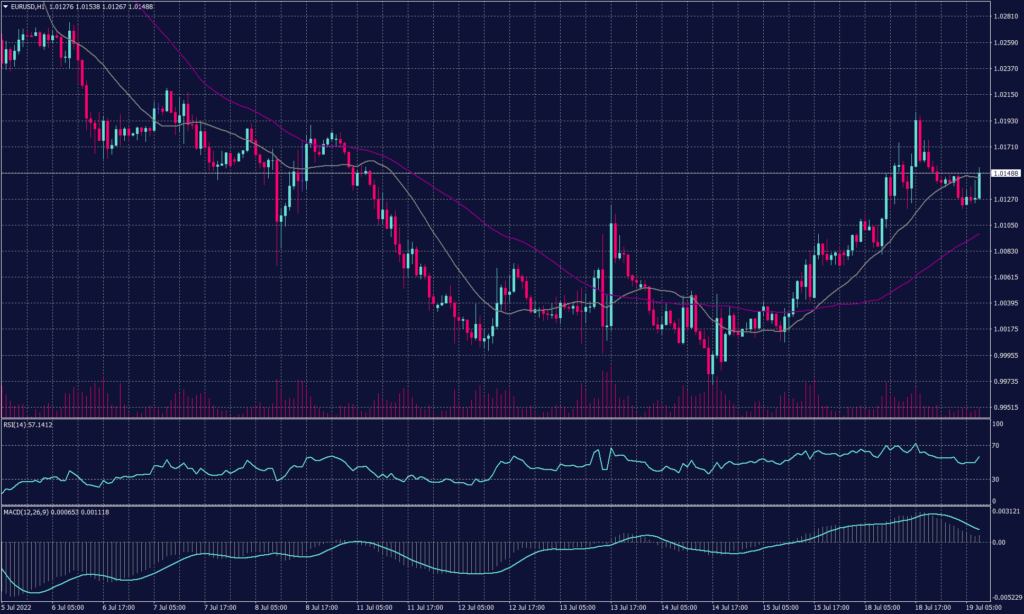
The euro slipped 0.08% to $1.01355 during the early trades, after adding around 0.6% overnight for the second day of gains. However, the common currency slid as low as $0.9952 on Thursday for the first time since December 2002, pressured by uncertainty about a potential energy supply crunch in the eurozone. Despite the uncertainty, investors expect ECB to raise interest rates on Thursday for the first time in more than a decade.
Meanwhile, the hourly chart reflects a corrective movement in a long secondary trend targeting 1.0210 as the next resistance. However, the daily chart remains to hold the negative trend aiming towards 0.9960.
PIVOT POINT: 1.0175
| SUPPORT | RESISTANCE |
| 0.9960 | 1.0210 |
| 0.9850 | 1.0350 |
| 0.9700 | 1.0470 |
Spot Gold (XAUUSD)
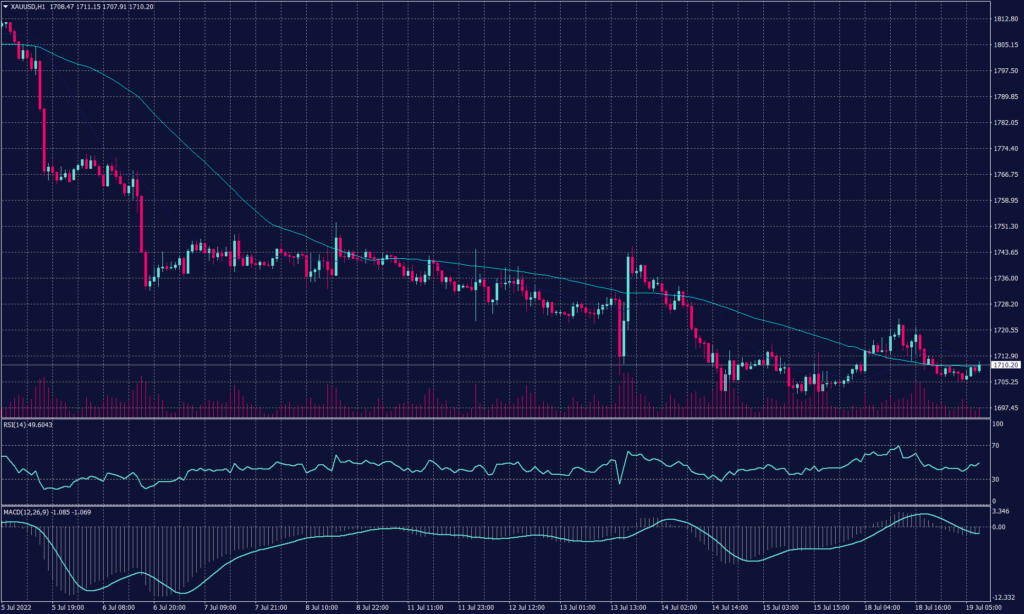
Gold was down 0.19% to $1,706.95 during the Asian session. It is hovering near an 11-month low as investors expect further monetary policy tightening and slower economic growth. Investors are eying the U.S. Federal Reserve’s meeting due on July 26-27 to get an indication of how aggressive the Fed will be in raising interest rates.
Gold continued the trade around the support at $1,710 per ounce this morning in Asia and shows a possibility to hit 1,700 sooner than anticipated. The daily chart, however, shows a continuation of the negative trend towards $1,680.
PIVOT POINT: 1,710
| SUPPORT | RESISTANCE |
| 1,700 | 1,715 |
| 1,680 | 1,720 |
| 1,675 | 1,732 |
West Texas Crude (USOUSD)
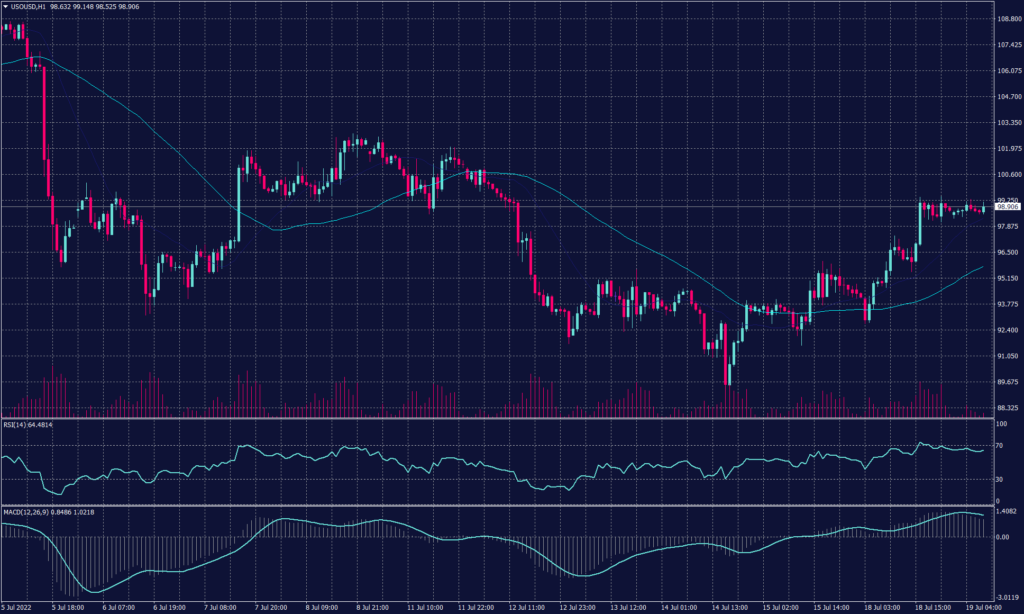
Crude oil held above $100 a barrel after posting the biggest one-day advance since May as worries of a slower market discouraged traders. West Texas Intermediate eased but retained part of its previous gains of more than 5%. That surge came after Saudi Arabia declined to commit to output increases following a visit by U.S. President Joe Biden.
WTI hits the resistance of $100 a barrel yesterday and remained trying to break above it. The rising momentum slowed as trading volume declined during the morning session. On the hourly chart, the prices show a tendency to decline as the resistance is strengthening below $100 a barrel. Meanwhile, technical indicators confirm a possibility of a drop towards $93.70 a barrel.
On the other hand, the daily chart shows a high tendency to reach $101 a barrel before it breaks the gains and decline.
PIVOT POINT: 100.00
| SUPPORT | RESISTANCE |
| 98.30 | 101.00 |
| 96.60 | 101.95 |
| 93.70 | 102.40 |
