

U.S. Dollar Index (USDX)
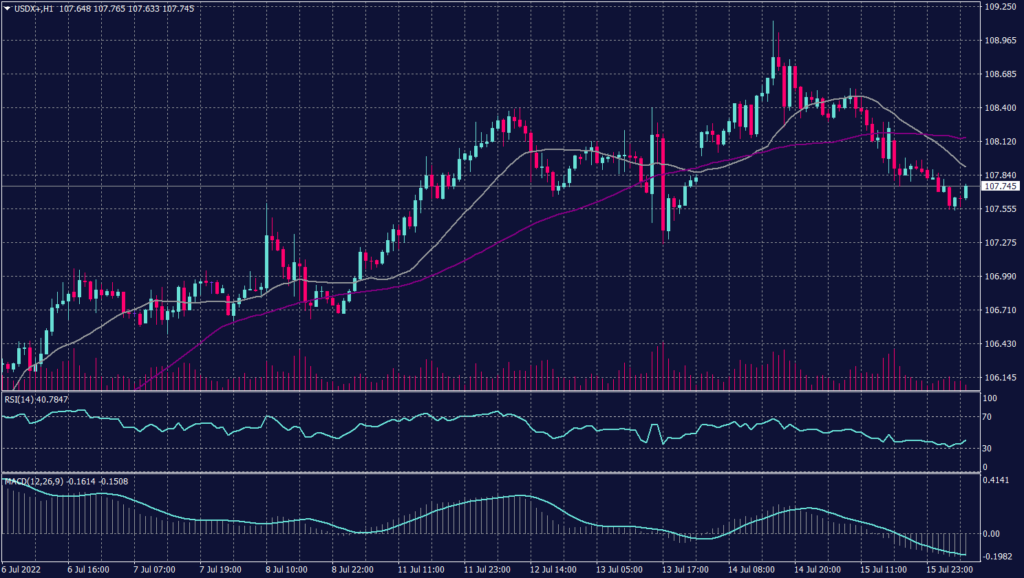
The U.S. Dollar Index retreats below its multi decade high as markets discounted the expectations of Fed interest rates hike. Traders raised bets that the Fed could raise rates by 100 basis points when it meets on July 26-27 as inflation rate is at 4 decades high.
The index is trading downward between the supports at 107.80 and 107.40. However, technical indicators show further decline while the moving averages show a possibility of a rebound. Additionally, the moving averages are crossed at 108.20 indicating a strong resistance. However, the daily chart confirms the continuation of the uptrend.
PIVOT POINT: 107.60
| SUPPORT | RESISTANCE |
| 107.40 | 107.80 |
| 107.20 | 108.60 |
| 106.65 | 108.80 |
Euro (EURUSD)
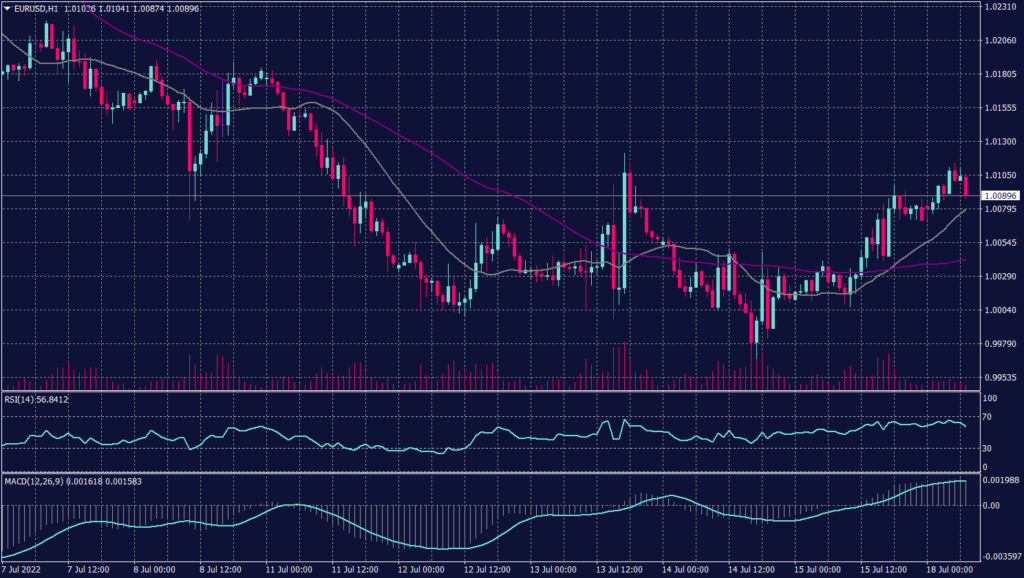
The euro’s collapsed below parity before bouncing back as ECB is expected to raise interest rates for the first time since 2011.
However,the common currency remains moving lower, but the hourly chart shows slight support at the parity level. Meanwhile, the daily chart indicates further decline and technical indicators confirm. The overall direction remains strong selling trend reaching below 0.9960
PIVOT POINT: 1.0090
| SUPPORT | RESISTANCE |
| 0.9960 | 1.0100 |
| 0.9850 | 1.0190 |
| 0.9700 | 1.0210 |
Spot Gold (XAUUSD)
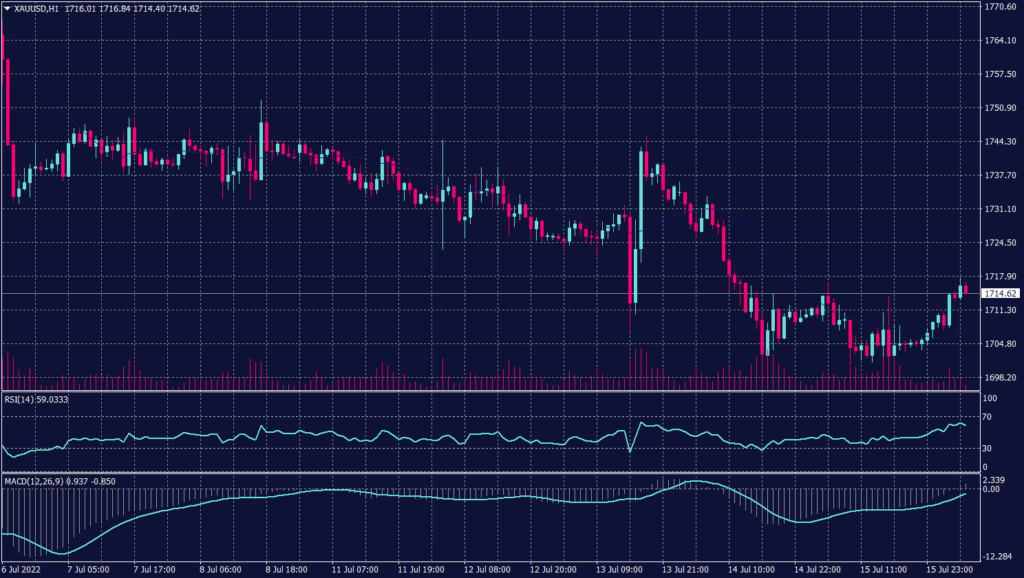
Gold bounced back from the support at $1,710 to trade around $1,715 per ounce during the Asian session. However, the market discounted the anticipations of rate hikes of 100 bp during next Fed meeting.
Gold continued the trade around the support at $1,710 per ounce this morning in Asia and shows a possibility to hit 1,700 sooner than anticipated. The daily chart, however, shows a continuation of the negative trend towards $1,680.
PIVOT POINT: 1,710
| SUPPORT | RESISTANCE |
| 1,700 | 1,715 |
| 1,680 | 1,720 |
| 1,675 | 1,732 |
West Texas Crude (USOUSD)
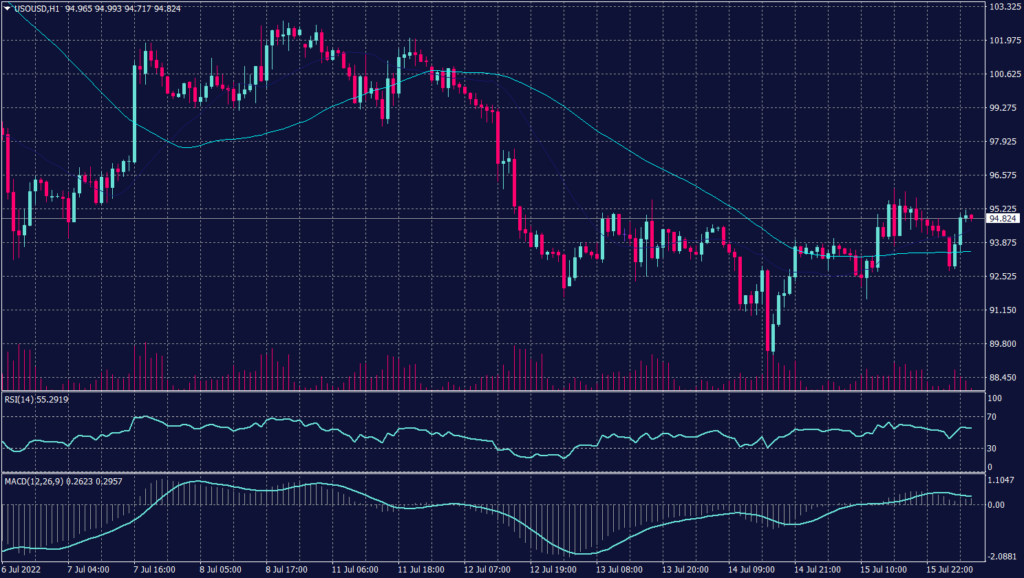
WTI Crude is settling above the support at $92.50 a barrel for the first time since April, as gains were limited by a U.S. supply report showing rising inventories and caution ahead of U.S. inflation data. On the hourly chart, WTI prices show a decrease in volume traded due to the worries about global growth and consumption.
PIVOT POINT: 95.60
| SUPPORT | RESISTANCE |
| 92.50 | 99.00 |
| 90.50 | 100.40 |
| 87.00 | 102.00 |
