

market news summary
U.S. Dollar Index (USDX)
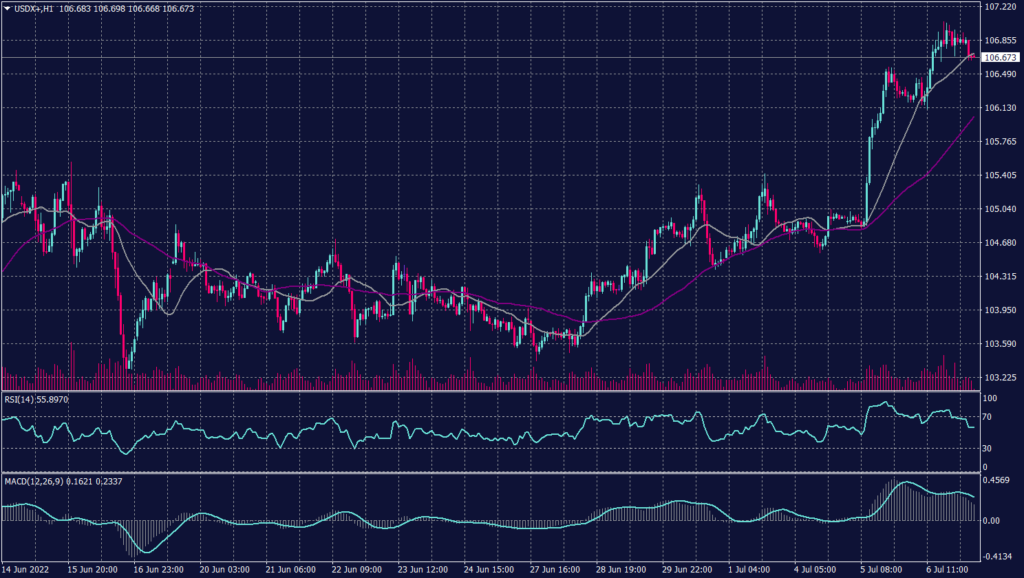
The dollar shook slightly this morning despite expectations of aggressive interest rate hikes that grew over the hawkish minutes of the U.S. Federal Reserve’s June meeting. The U.S. dollar remains strong for the medium term due to aggressive Federal Reserve interest rate rise expectations and safe-haven appeal stemming from global recession fears.
The daily chart indicates a continuation of the uptrend in the long term towards a new high. Technical indicators can’t confirm the continuation while moving averages show declining signals. The hourly chart shows an upward movement but keeps the tendency for a slight decline on the way.
PIVOT POINT: 106.60
| SUPPORT | RESISTANCE |
| 106.10 | 106.75 |
| 105.80 | 107.10 |
| 105.00 | 107.40 |
Euro (EURUSD)
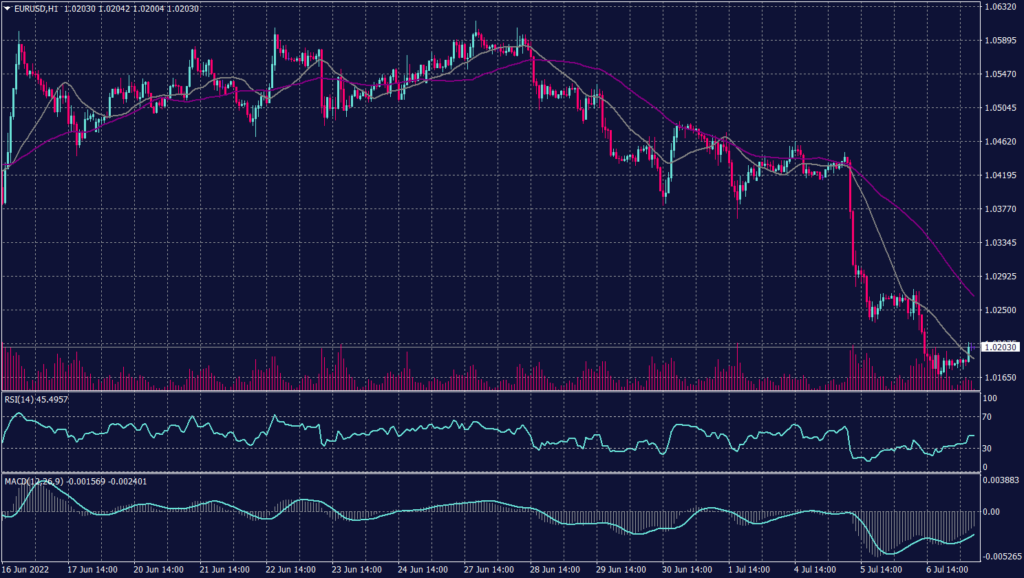
The euro fell to its lowest level in two decades on Tuesday as fears of a recession in the euro zone ramped up, with gas prices soaring and the Ukraine war showing no signs of abating.
Euro zone inflation hit a record 8.6% in June, prompting the European Central Bank to give markets advance notice of its intention to hike interest rates for the first time in 11 years at its July meeting.
The euro shed around 1.5% for the session to hit $1.0210 against the dollar.
The Euro pair drops to a new 20 years low and hinders any sign of recovery. The overall direction remains strong selling trend reaching below 1.0210
PIVOT POINT: 1.0210
| SUPPORT | RESISTANCE |
| 1.0190 | 1.0275 |
| 0.9960 | 1.0310 |
| 0.9810 | 1.0350 |
Spot Gold (XAUUSD)
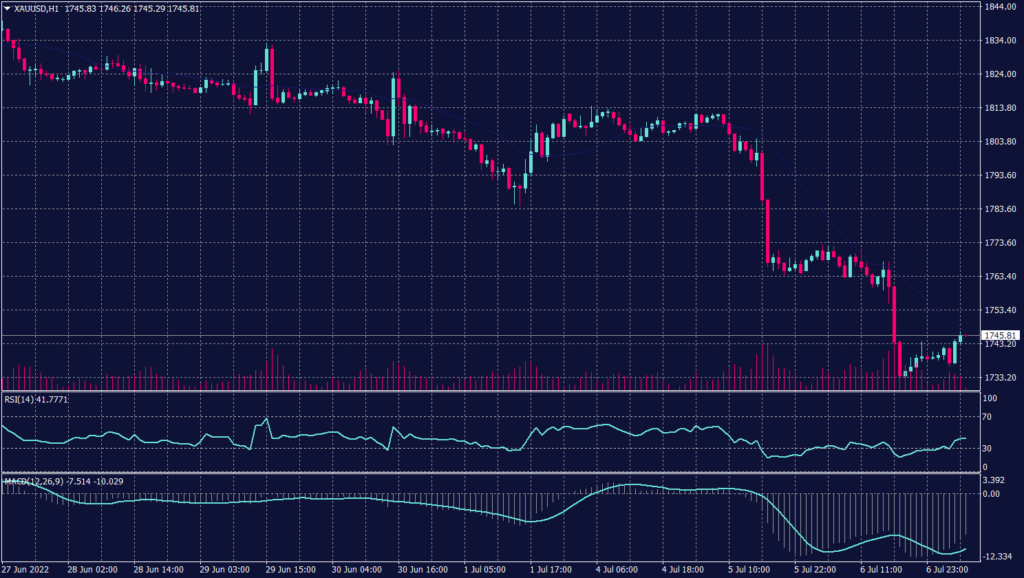
Gold was up 0.36% to $1,742.80 this morning in Asia as the U.S. dollar paused for breath after surging to 20-year highs. Investors have priced in another 75-basis point interest rate hike in July from the Fed after FOMC minutes were released on Wednesday.
Gold continued the decline below $1,744 per ounce this morning in Asia. Gold broke below the support at $1,800 and didn’t stop until the emotional support at $1,742. The daily chart, however, shows a continuation of the negative trend towards $1,720.
PIVOT POINT: 1,745
| SUPPORT | RESISTANCE |
| 1,750 | 1,771 |
| 1,740 | 1,778 |
| 1,720 | 1,785 |
West Texas Crude (USOUSD)
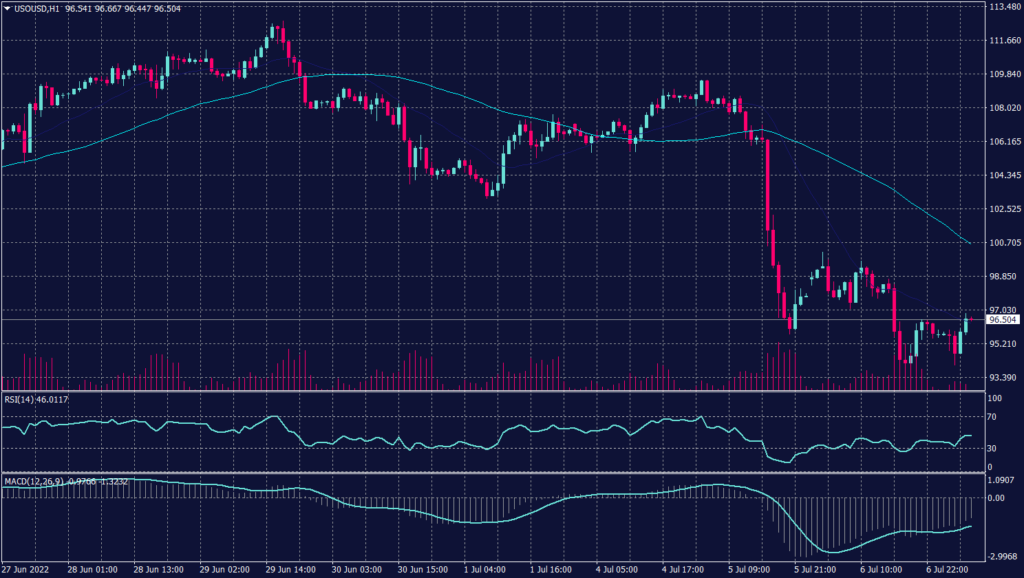
Oil was up on Thursday morning in Asia on supply concerns, after falling during the previous two sessions. Brent oil rose 0.51% to $101.20 while WTI jumped 0.56% to $99.11. Both benchmarks closed on Wednesday at their lowest since April 11.
Crude supply data from the American Petroleum Institute, released on Wednesday, showed a draw of 3.825 million barrels. Investors now await U.S. crude supply data from the U.S. Energy Information Administration, which will be released later in the day.
On the hourly chart, WTI prices show a decrease in volume traded due to the worries about the global growth and consumption. However, the daily chart confirms the high probability of the decline and targets $95.
PIVOT POINT: 95.90
| SUPPORT | RESISTANCE |
| 95.00 | 98.00 |
| 93.00 | 102.00 |
| 87.00 | 104.00 |
