

market news summary
U.S. Dollar Index (USDX)
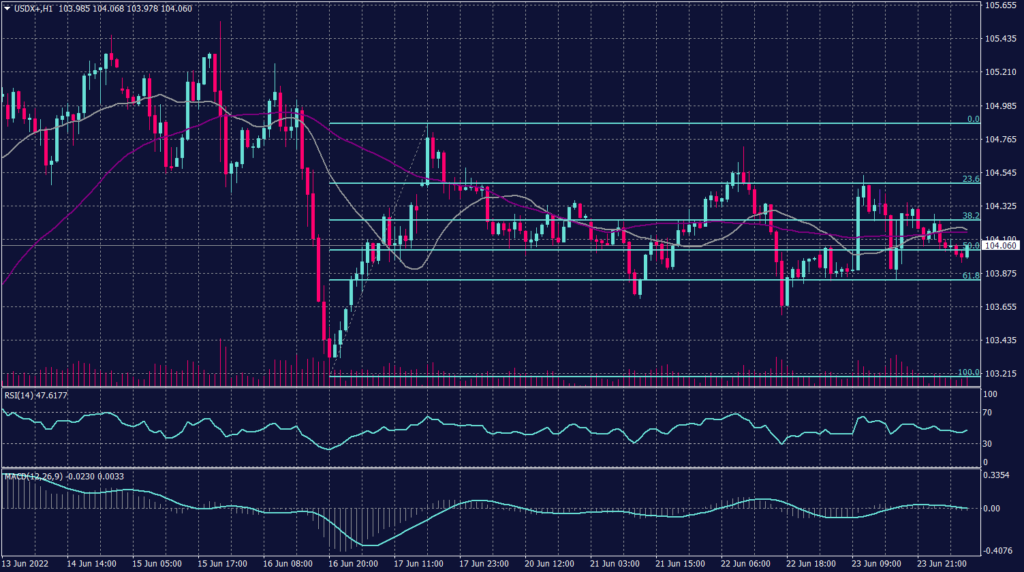
The U.S. dollar slipped against its major peers during the Asian session and is set for its first weekly decline this month. Investors assess the path for Federal Reserve policy and whether aggressive rate hikes would trigger a recession.
The dollar index edged down 0.07% to 104.33. However, Markets now betting on more cautious policy action from the Fed after another expected 75 basis point rate increase in July.
Technically:
The USDX traded lower today to trade below 104 as recession fears increase. Meanwhile, the USDX remains in a horizontal pattern pressuring the support at 103.50. Additionally, hourly chart price action indicates a further decline while the technical indicators are neutral.
Meanwhile, the daily chart indicates a continuation of the uptrend in the longer term. Technical indicators confirm the continuation and moving averages show a slower rise. Fibonacci retracements show support around 104.00.
PIVOT POINT: 104.00
| SUPPORT | RESISTANCE |
| 103.50 | 104.60 |
| 102.60 | 105.10 |
| 102.30 | 105.60 |
Euro (EURUSD)
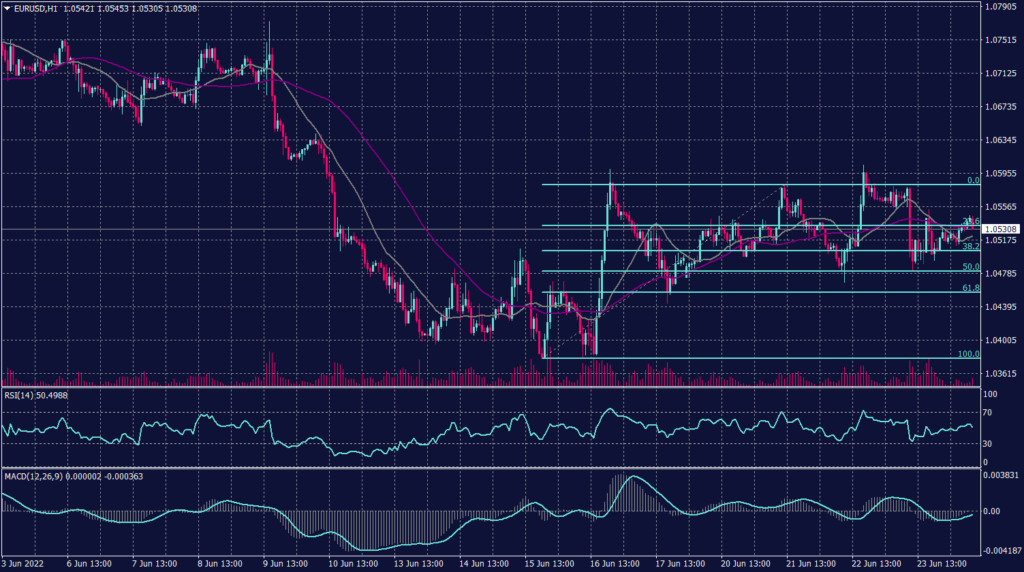
The Euro gained 0.11% to $1.0533 against the greenback, but after tumbling 0.44% overnight after weaker-than-expected German and French PMI figures. Germany also triggered an alarming call of its emergency gas plan on Thursday in response to falling Russian supplies.
EURUSD remains in the declining channel towards 1.0400, while technical indicators confirm the decline. On the hourly chart, the pair is moving in a horizontal fashion.
PIVOT POINT:1.0520
| SUPPORT | RESISTANCE |
| 1.0480 | 1.0550 |
| 1.0450 | 1.0600 |
| 1.0400 | 1.0670 |
Sterling Pound (GBPUSD)
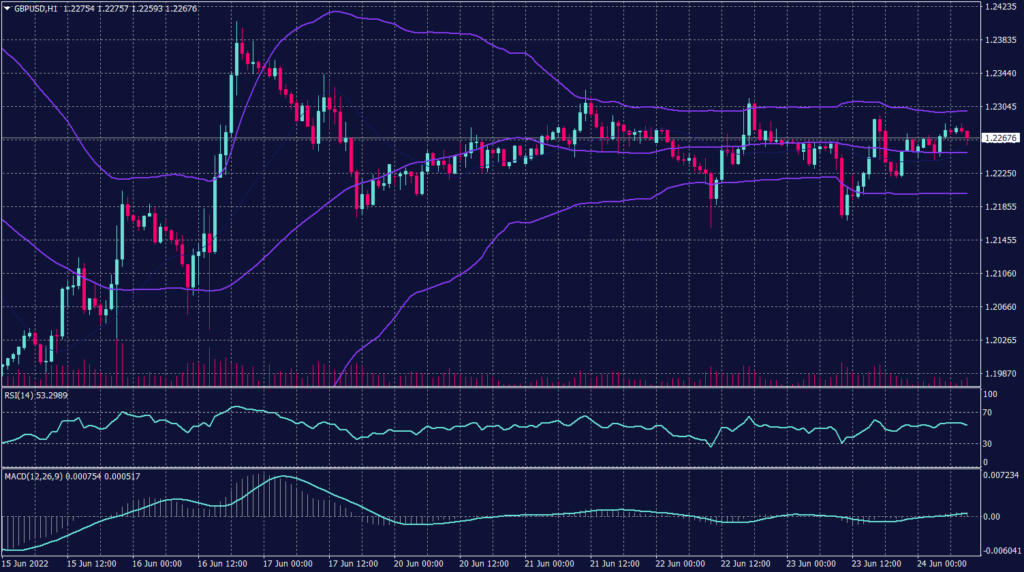
The sterling pound is moving horizontally and shows a caution trading environment. On the daily chart, the pair remains to weaken and targets its lowest level since March 2020 between 1.1446 and 1.1410. The cable cannot find shelter in the upcoming BOE statement unless it massively exceeded market expectations.
PIVOT POINT:1.2280
| SUPPORT | RESISTANCE |
| 1.1950 | 1.2300 |
| 1.1820 | 1.2380 |
| 1.1700 | 1.2480 |
Spot Gold (XAUUSD)
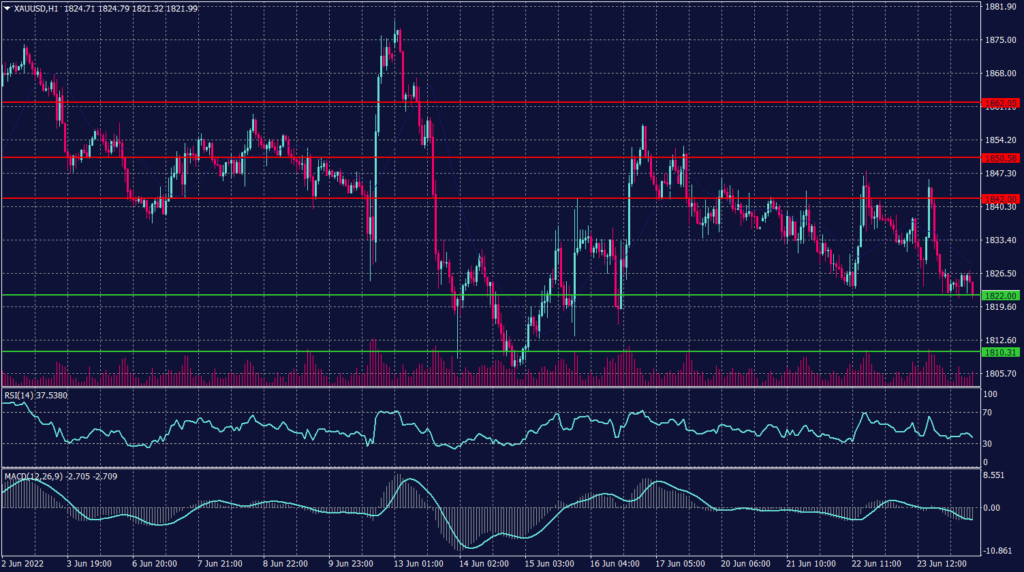
Gold was down 0.21% to $1,825.95 during the Asian sessions. The precious metal is set for its second straight decline amid worries of big interest rate hikes from the U.S. Federal Reserve weighing on bullion demand.
Fed Chair Jerome Powell reiterated that the central bank’s inflation fight is “unconditional” on Thursday, while Fed Governor Michelle Bowman said she supports another 75-basis points interest rate hike in July, followed by a few more half-point hikes.
Spot gold may test a support at $1,821 per ounce, with a good chance of breaking below this level and falling to $1,810.
PIVOT POINT: 1,830
| SUPPORT | RESISTANCE |
| 1,815 | 1,842 |
| 1,810 | 1,850 |
| 1,790 | 1,855 |
West Texas Crude (USOUSD)
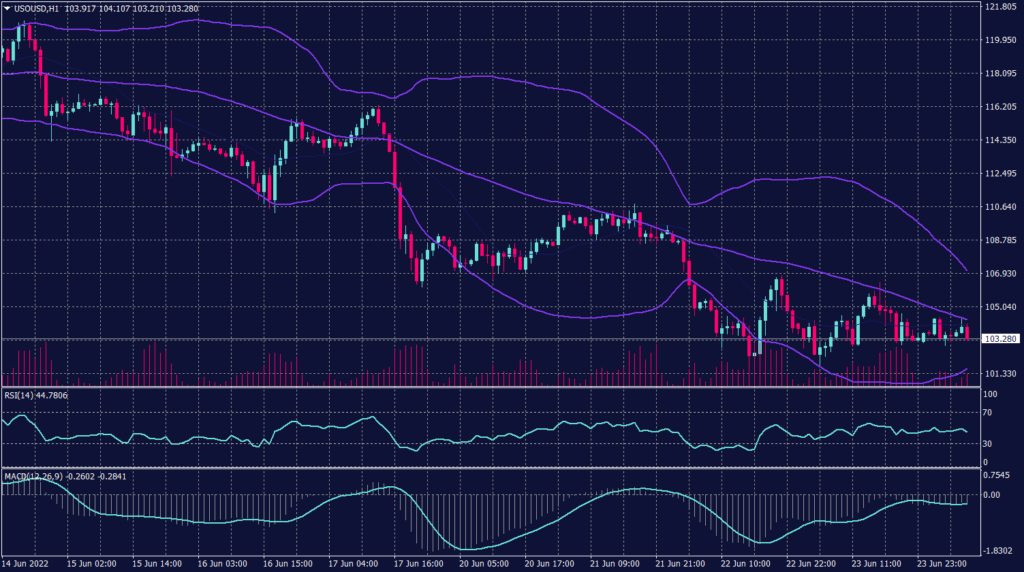
Oil was down on Friday morning in Asia as fears of slower demand from slowing U.S. economic growth and supply concerns weighed on the market. Brent oil futures inched down 0.09% to $109.94, and crude oil WTI futures gained 0.14% to $104.42.
The OPEC+ will likely agree to a plan to increase output by 648,000 barrels a day in August. Wednesday’s U.S. crude supply data from the American Petroleum Institute showed a build of 5.607 million barrels for the week ended June 17. The U.S. Energy Information Administration’s weekly oil data will be delayed until at least next week due to systems issues.
Technically:
On the hourly chart, WTI prices show an increase in volume traded due to the increase in supply while prices show light support near $104. Meanwhile, the daily chart confirms the decline and targets $98 a barrel after breaking the support at $106.30 yesterday.
PIVOT POINT: 104.40
| SUPPORT | RESISTANCE |
| 102.20 | 108.10 |
| 100.00 | 109.80 |
| 98.00 | 111.00 |
