

market news summary
Markets fluctuate in corrective patterns
The dollar index broke 103.60
Gold supported at $1,810
U.S. Dollar Index (USDX)
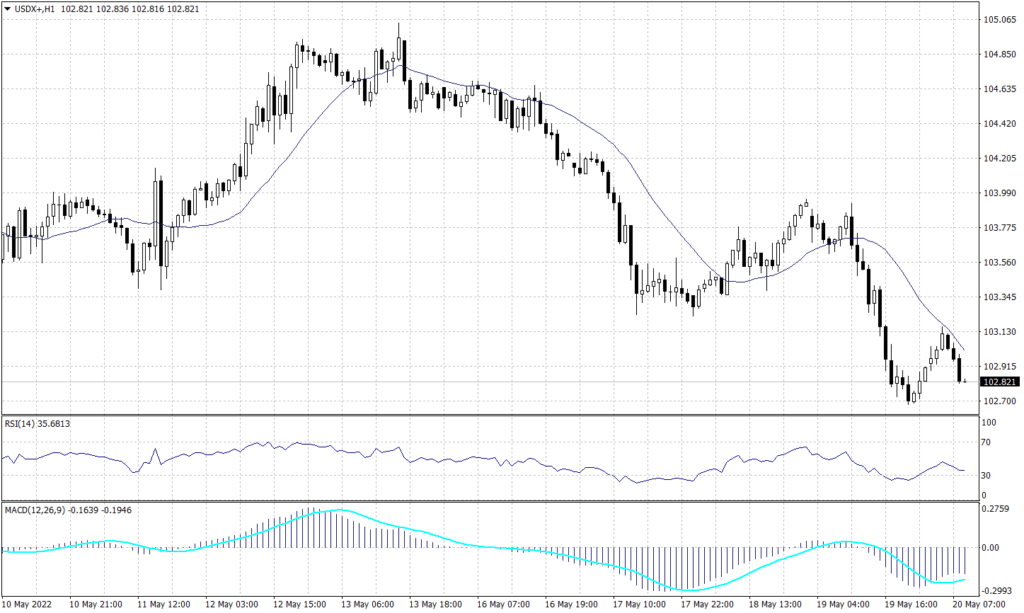
The dollar index failed to hold above its support above 103.60 and fell to touch 102.68 to be the lowest in two weeks. Additionally, the index traded below the 20 days moving average on the daily chart indicating a possibility for a further decline. However, the index remains in the positive channel in the long run unless it broke below 102.60.
Likewise, the index forms a declining pattern on the hourly chart which targets 102.50 unless it closed above the 20 hours moving average. Technical indicators are not providing clear signals which indicate the need to hold until there is a clear direction.
PIVOT POINT: 102.50
| SUPPORT | RESISTANCE |
| 102.35 | 103.10 |
| 102.00 | 103.35 |
| 101.60 | 104.10 |
Euro (EURUSD)
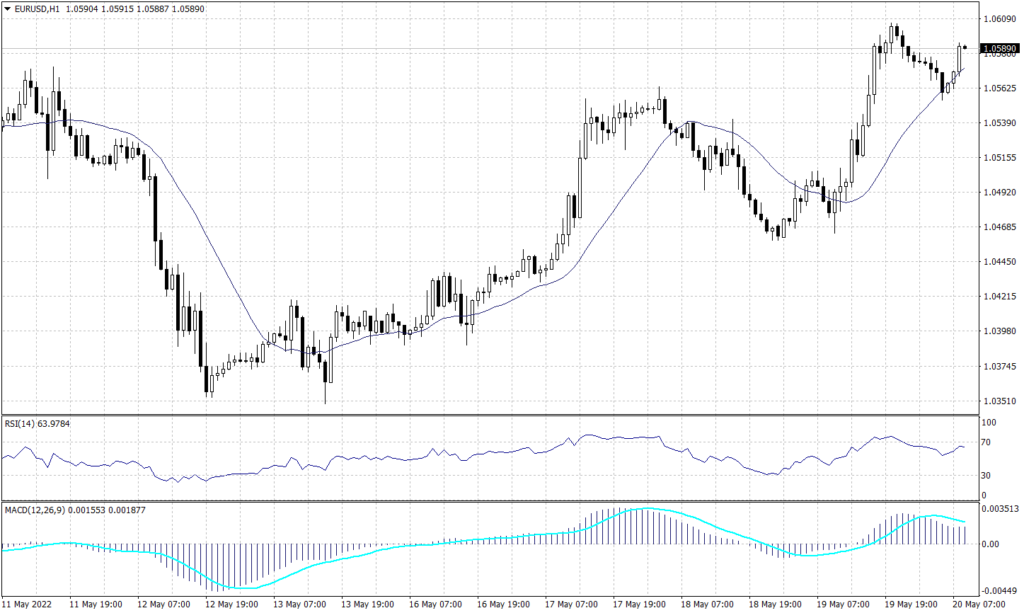
The shared currency retains its short-term gains for the past few days but trades in a short candle on the daily chart today. Additionally, the pair formed light support above 1.0540 on the hourly chart signals a possibility for a further advance. However, the advance is not confirmed unless the pair penetrated above the resistance of 1.0610.
The common currency remains in a downwards trend over the daily time frame, even with the gains recorded over the last several days. The EURUSD touched resistance at 1.0540 before showing a tendency to trade lower.
Technical indicators show a higher possibility to fall than continuing the uptrend, however, the moving average on the daily chart remains above the current price levels.
PIVOT POINT: 1.0600
| SUPPORT | RESISTANCE |
| 1.0550 | 1.0610 |
| 1.0510 | 1.0650 |
| 1.0470 | 1.0675 |
Sterling Pounds (GBPUSD)
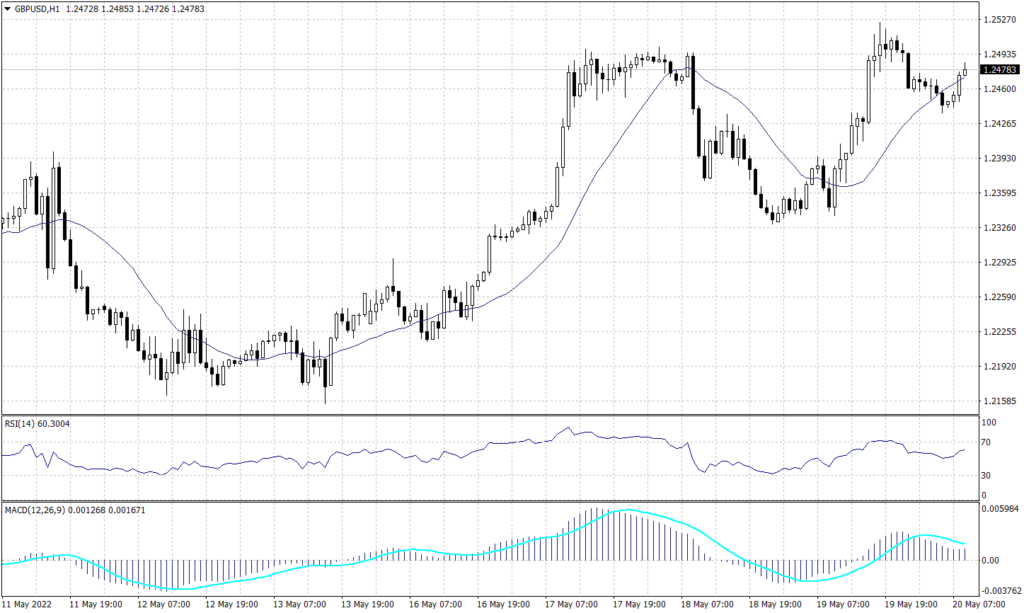
The Cable remains under pressure below the resistance level of 1.2550 on both the daily and hourly charts. However, the sterling pound remains inside the declining channel on the daily time frame. Meanwhile, the pair shows a possibility to move horizontally on the hourly time frame between 1.2440 and 1.2500.
The RSI and MACD are showing signals for a further decline, while price action retains the reading of 1.2100 on the daily time frame.
PIVOT POINT: 1.2470
| SUPPORT | RESISTANCE |
| 1.2440 | 1.2500 |
| 1.2350 | 1.2565 |
| 1.2100 | 1.2690 |
Japanese Yen (USDJPY)
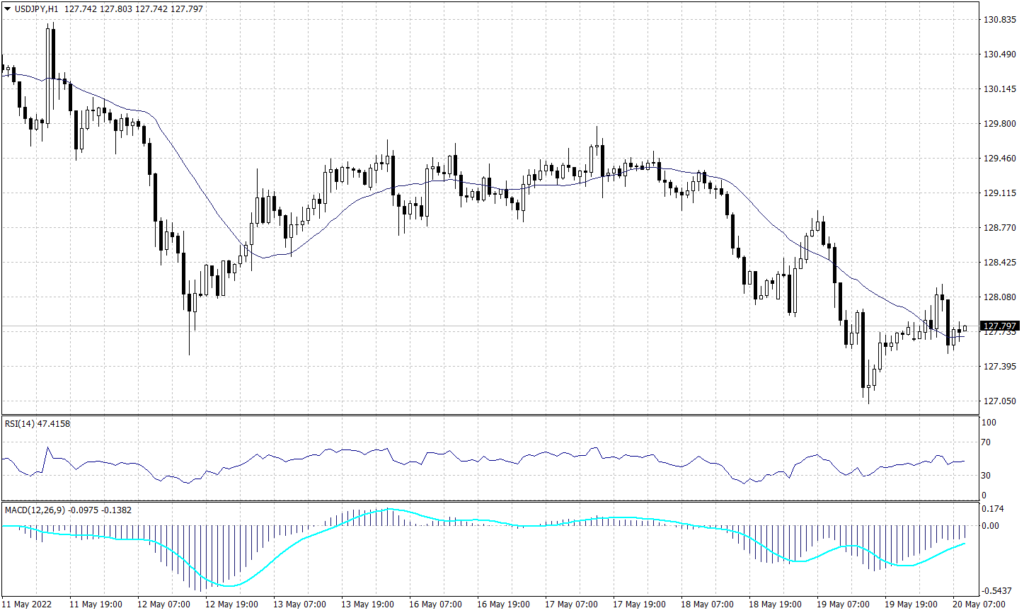
The Japanese Yen retains its momentum against the greenback and solidifies its trend after touching its best rate in a month at 127.00. The USDJPY pair traded below the support of 128.70 today and building resistance at 128.00.
Meanwhile, after breaking below 128.70 the pair is confirming the downtrend on the hourly chart and signaling a higher possibility of the continuation on the daily chart. While the moving average reading indicates that the current level is critical resistance, MACD and RSI readings remain neutral.
PIVOT POINT: 128.00
| SUPPORT | RESISTANCE |
| 127.80 | 128.70 |
| 127.00 | 129.10 |
| 126.60 | 129.45 |
Spot Gold (XAUUSD)
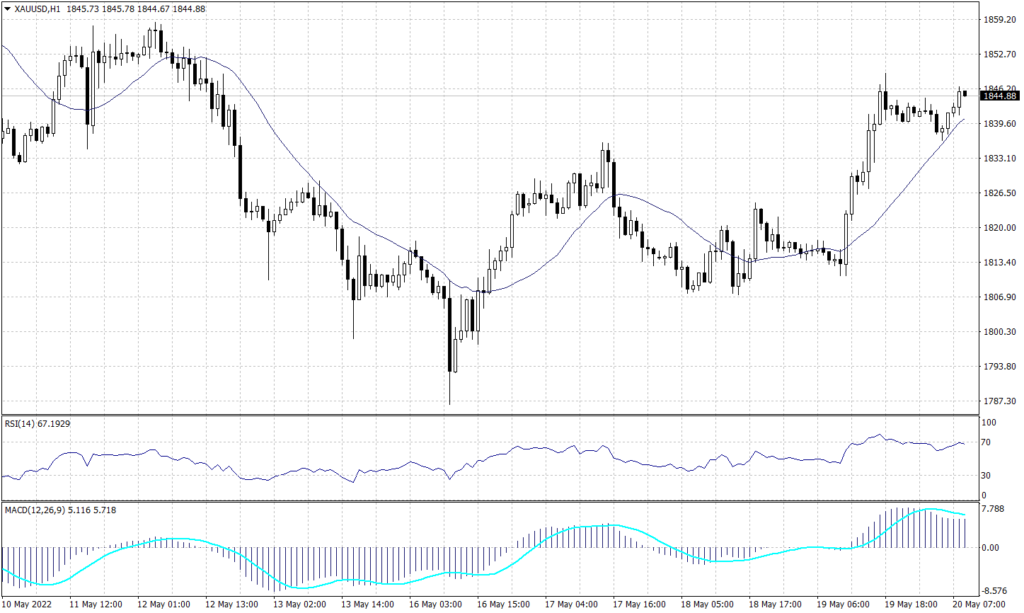
The yellow metal trades higher for the third day touching 1,845 during the early trades and heading higher. Gold formed a corrective pattern on the daily chart but remains inside the declining channel. However, the hourly chart shows a possibility for a drop since the metals have no support above 1,810.
However, the chart remains negative on the daily time frame while solidifying the support at 1,810. Meanwhile, the RSI indicates that the metal is overbought while MACD is close to the intersection point.
PIVOT POINT: 1,850
| SUPPORT | RESISTANCE |
| 1,810 | 1,875 |
| 1,800 | 1,895 |
| 1,792 | 1,905 |
West Texas Crude (USOUSD)
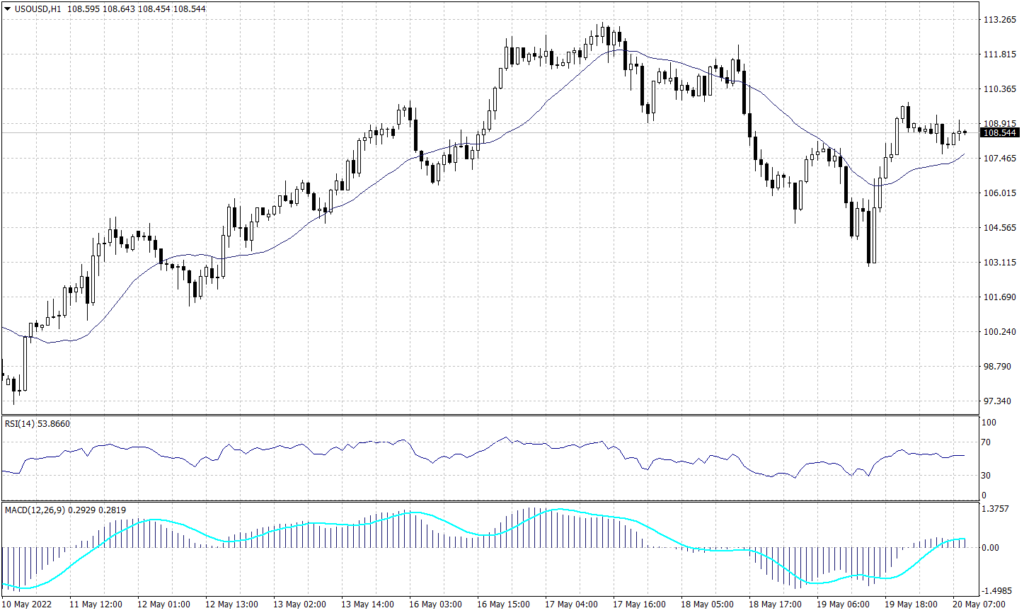
West Texas crude fluctuated between $104 and $110 for most of the week. Meanwhile, on the hourly chart, the crude shows support at $107.10 and resistance below $111.30.
Due to the heavy buying pressure, technical indicators show a possibility to see crude oil lower at $107. However, price action and moving average show a higher probability of continuing climbing.
PIVOT POINT: 108.50
| SUPPORT | RESISTANCE |
| 107.10 | 111.30 |
| 105.75 | 112.75 |
| 104.30 | 115.00 |
