

MARKET NEWS SUMMARY
Euro on five years low;
Cable at the weakest in three years;
Gold bears are in control;
Bitcoin set to further decline.
Euro (EURUSD)
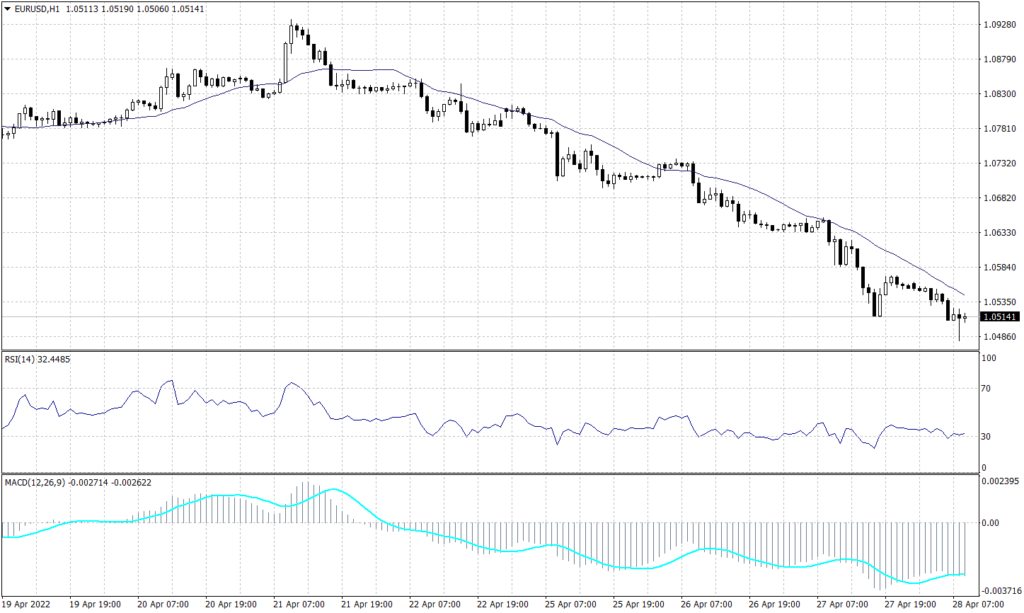
The Euro traded at its lowest rate in five years at 1.0520, thus it retains the negative rally. The charts show a continuation of the downtrend over the long and short time frames, additionally, the pair is not showing signs of recovery. However, for the pair to bounce it requires a huge positivity in the economic data.
The readings from the RSI and MACD are diverging from the present price action. As the technical indicators show stability around the current levels, while price action indicates a probability to drop further.
PIVOT POINT: 1.0520
| R1 | R2 | R3 | |
| RESISTANCE | 1.0575 | 1.0610 | 1.0650 |
| S1 | S2 | S3 | |
| SUPPORT | 1.0490 | 1.0455 | 1.0410 |
Sterling Pounds (GBPUSD)
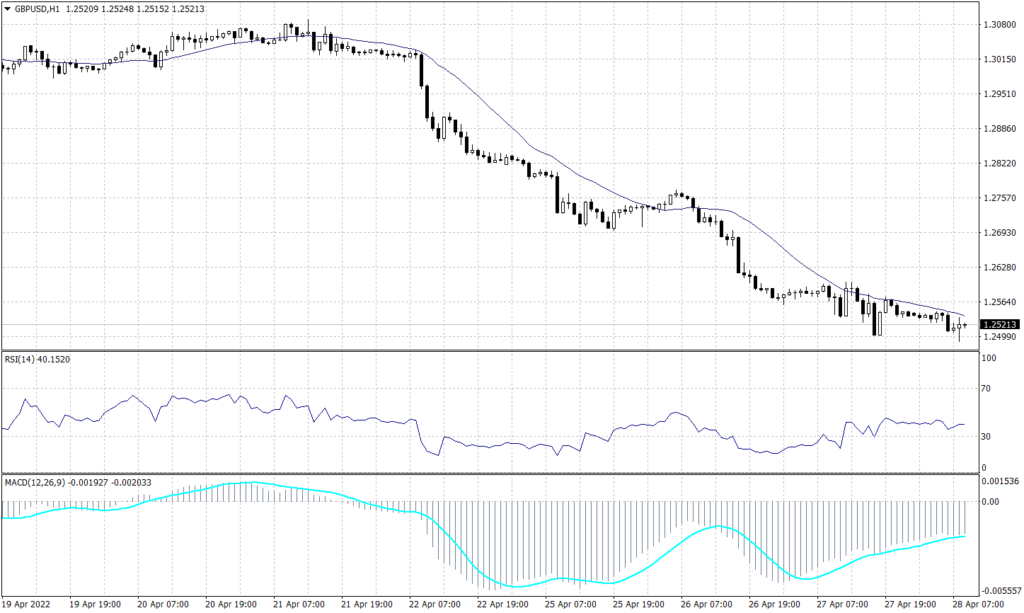
The Cable retains its downtrend as the bears have taken control of the market. It is expected for the sterling pound to reach the low of 1.2300 before bulls reclaim the driver seat. Meanwhile, the pair is trading around three years low last seen on July 19, 2020.
Like the neighbour currency, GBPUSD readings from the RSI and MACD are diverging from the present price action. As the technical indicators show stability around the current levels, while price action indicates a probability to drop further.
PIVOT POINT: 1.2500
| R1 | R2 | R3 | |
| RESISTANCE | 1.2565 | 1.2635 | 1.2690 |
| S1 | S2 | S3 | |
| SUPPORT | 1.2440 | 1.2360 | 1.2300 |
Spot Gold (XAUUSD)

Bears finally held a grip over the precious metal, as gold prices broke through the bullish support below 1,900. The hourly chart signals a continuation towards 1,850, while the long-term technical view indicates a bottom of 1,800 based on the slope of the chart.
PIVOT POINT: 1,880
| R1 | R2 | R3 | |
| RESISTANCE | 1,890 | 1,905 | 1,915 |
| S1 | S2 | S3 | |
| SUPPORT | 1,870 | 1,850 | 1,840 |
Bitcoin (BTCUSD)
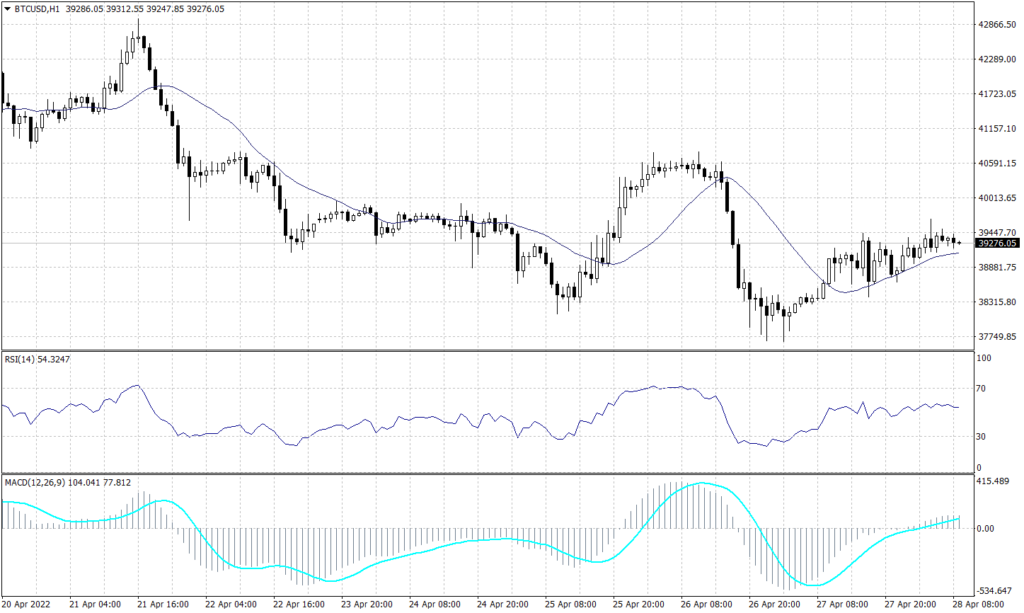
Despite the heavy bullish pressure, the Bitcoin trend remains solid bearish. While prices have formed a reversal pattern between the Fibonacci retracement levels of 50.0 and 61.8, the daily time frame trend remains unfavourable. Furthermore, both the RSI and MACD indicators show a likelihood of further decline.
PIVOTPOINT: 39,200
| R1 | R2 | R3 | |
| RESISTANCE | 39,500 | 40,100 | 40,655 |
| S1 | S2 | S3 | |
| SUPPORT | 38,890 | 38,680 | 38,360 |
Nikkei 225 (JPN225)
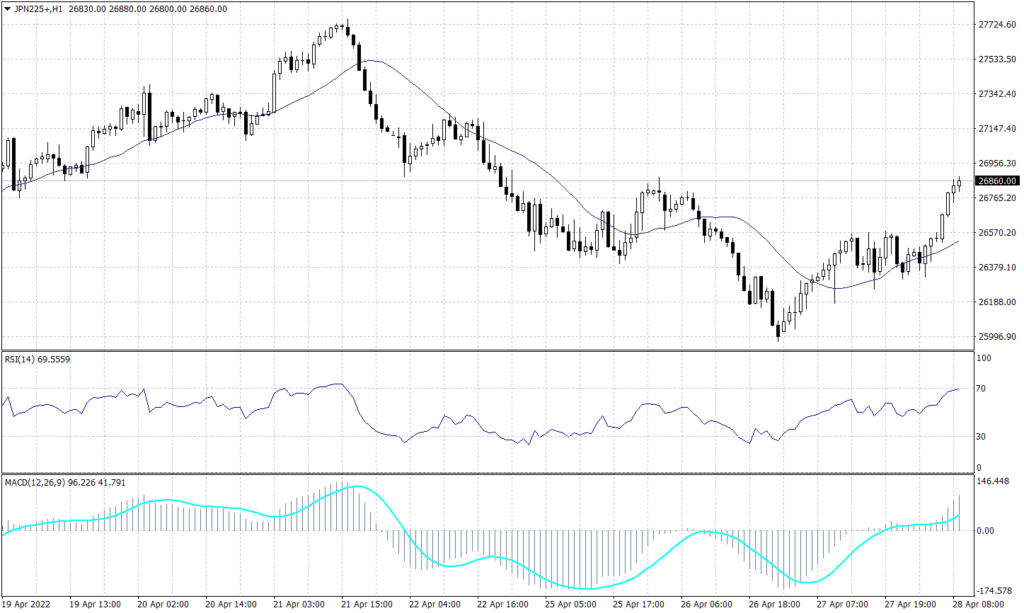
From the daily time frame, the Nikkei 225 exhibits a downward price movement. Similarly, the hourly chart is indicating a negative trend. The price is currently in a deep retracement to the level of 26,870 signaling a continuation of the negative trend. The RSI and MACD both point to a negative continuation to 24,750.
PIVOT POINT: 26,870
| R1 | R2 | R3 | |
| RESISTANCE | 27,210 | 27,470 | 27,740 |
| S1 | S2 | S3 | |
| SUPPORT | 26,590 | 26,290 | 25,990 |
