

Market News Summary
U.S. dollar at five years high
Euro towards 1.0325
Gold is at a critical level
Crude oil under supply pressure
Euro (EURUSD)
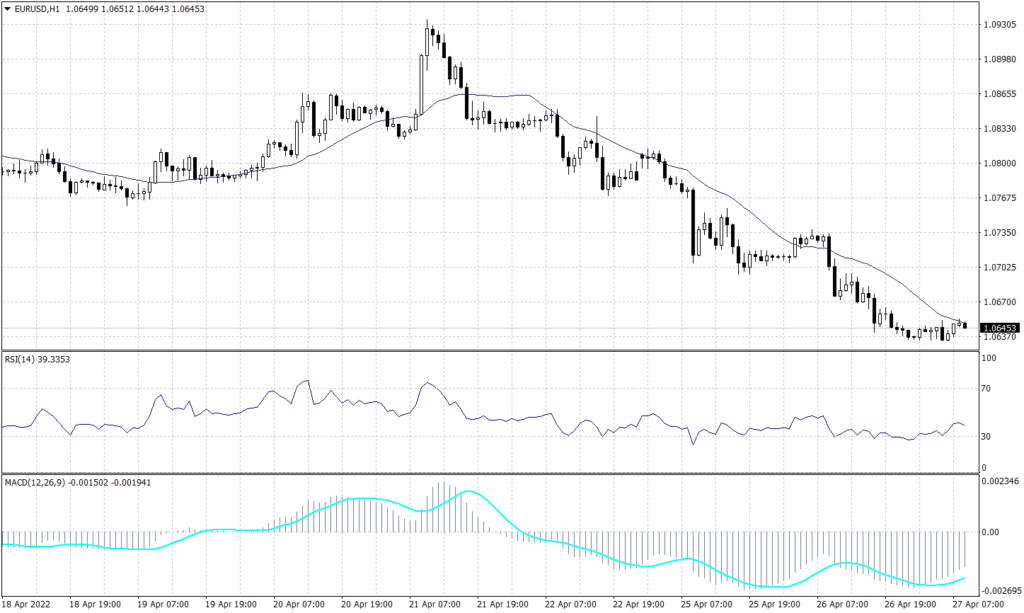
The common currency is under unrelenting pressure as its counterparty is on a rocketing breakout. EUR/USD has cracked the 2020 lows of 1.0635 and heading towards the five-year low of 1.0600.
The pair is not showing any signs of recovery, but it is showing signs of targeting 1.0635 on the hourly chart. Meanwhile, on the longer time frame, the pair shows a possibility to reach 1.0325. Technical indicators show a slight swing along the way but remain confirming the downward trend.
PIVOT POINT: 1.0640
| R1 | R2 | R3 | |
| RESISTANCE | 1.0665 | 1.0730 | 1.0750 |
| S1 | S2 | S3 | |
| SUPPORT | 1.0605 | 1.0570 | 1.0530 |
Japanese Yen (USDJPY)
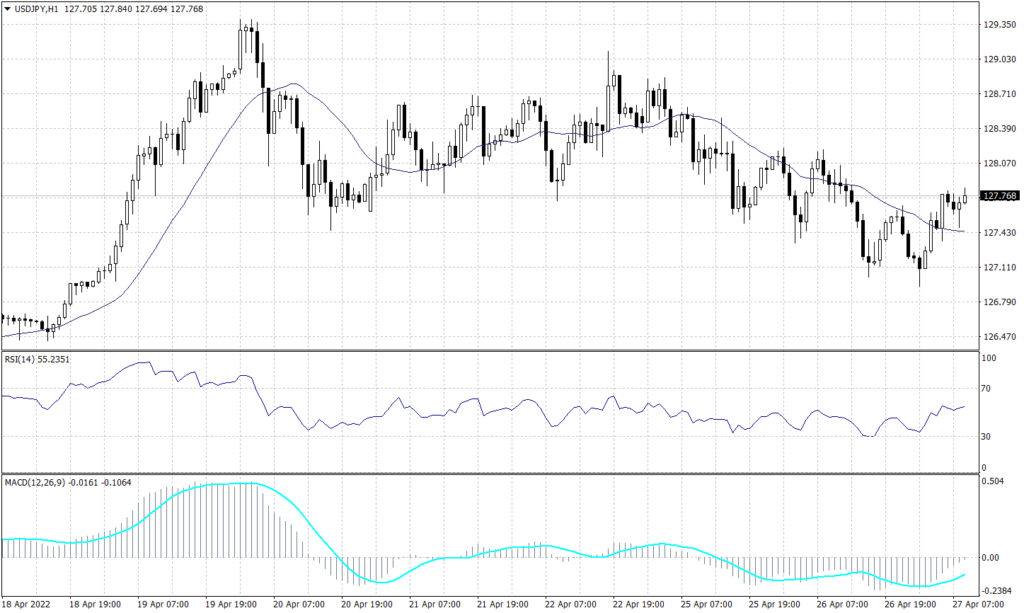
The Japanese Yen found slight support below 128 during the Asian session today. However, USDJPY is expected to remain under 128.40 during the day as the resistance gets more intense. Price action shows a possibility for further decline towards 127.10 while the technical indicators signal a bounce towards 128.40.
PIVOT POINT: 127.70
| R1 | R2 | R3 | |
| RESISTANCE | 128.00 | 128.15 | 128.40 |
| S1 | S2 | S3 | |
| SUPPORT | 127.60 | 127.40 | 127.10 |
Gold (XAUUSD)
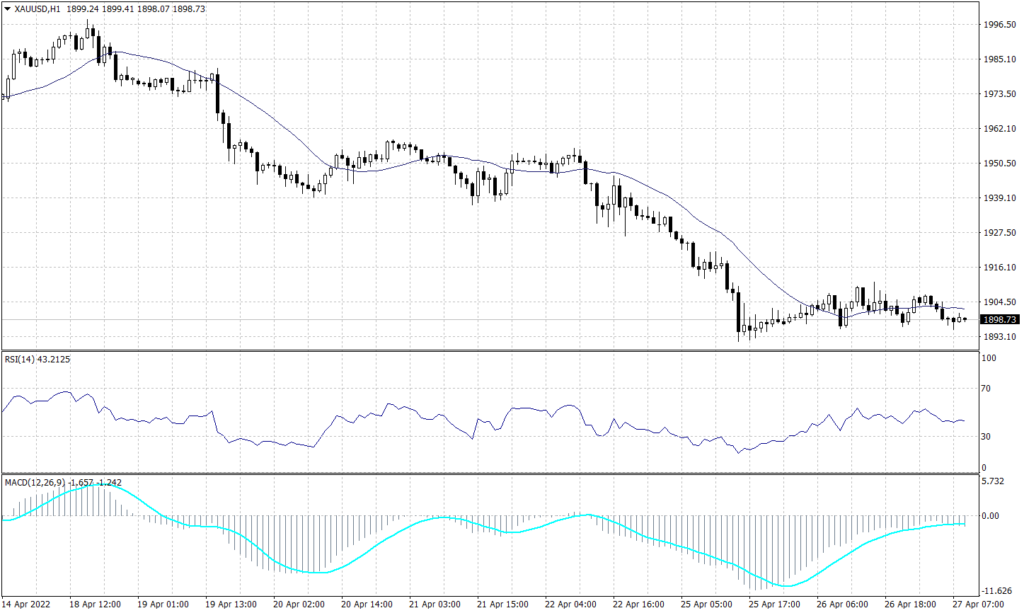
The precious metal is seen to remain bearish as it was traded below $1,900 during the early trades. The gold is expected to move towards 1,850 over the long run unless it bounced back above $1,920. In the short term, XAUUSD remains supported above $1,890. However, if the price broke below $1,890, it is expected to see the prices near $1,850. Technical indicators show a further drop towards $1,890 during the day.
PIVOT POINT: 1,900
| R1 | R2 | R3 | |
| RESISTANCE | 1,905 | 1,910 | 1,920 |
| S1 | S2 | S3 | |
| SUPPORT | 1,897 | 1,895 | 1,890 |
Dow Jones (US30)
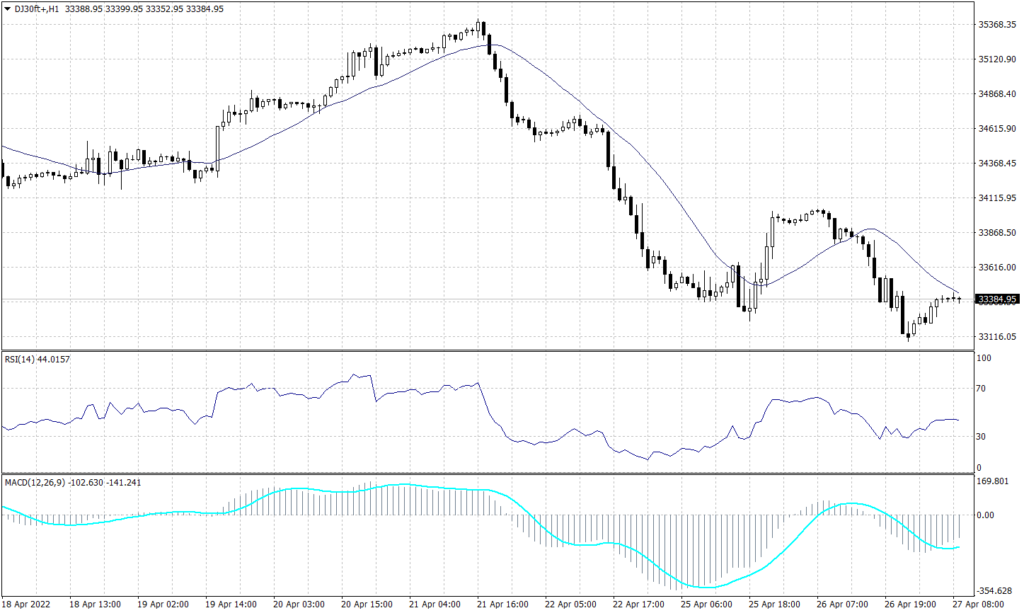
The long-term view of the Dow Jones shows a further decline after breaking below the support at 34,300. Furthermore, the U.S. blue-chip is expected to decline to 32,700. Meanwhile, the short-term chart shows support above 33,400. Technically, the Dow Jones is expected to fluctuate around 33,400 with a tendency to fall towards 33,230.
PIVOT POINT: 33,500
| R1 | R2 | R3 | |
| RESISTANCE | 33,675 | 33,900 | 34,150 |
| S1 | S2 | S3 | |
| SUPPORT | 33,230 | 33,030 | 32,840 |
WTI (USOUSD)
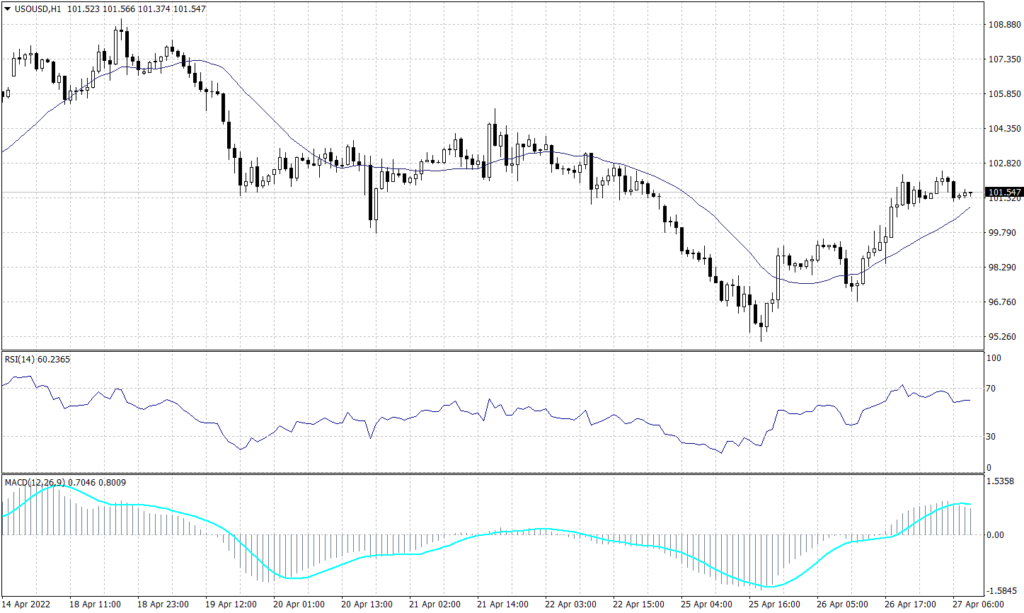
WTI fluctuated in a range between $95 and $105 since March 28 while keeping the negative outlook and the possibility of moving towards $90 if the price broke below $95. The short-term chart however shows strong support above $101.50 due to the current supply worries. Technical indicators show a high tendency to fall towards $98.80 during the day.
PIVOT POINT: 101.50
| R1 | R2 | R3 | |
| RESISTANCE | 102.50 | 102.80 | 103.30 |
| S1 | S2 | S3 | |
| SUPPORT | 101.20 | 98.80 | 98.20 |
