

MARKET NEWS SUMMARY
U.S. Dollar Index (USDX)
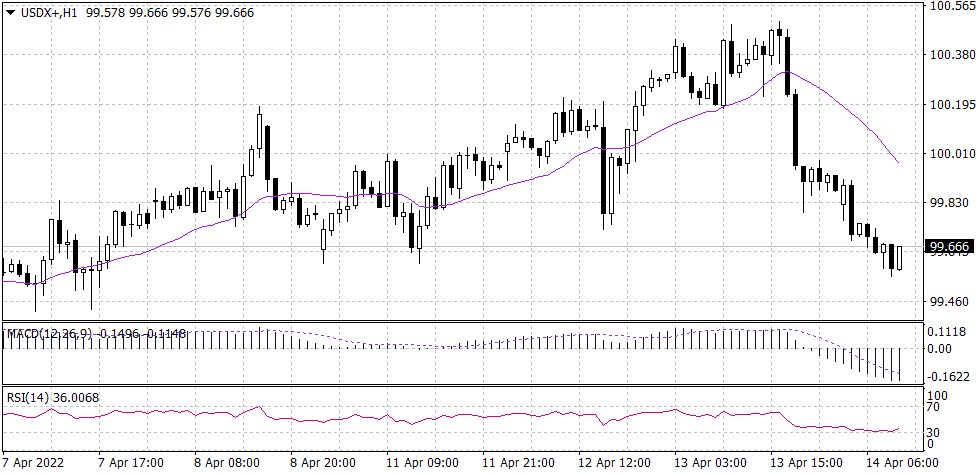
USDX failed to break above the resistance level of 100.40, which caused the corrective movement towards the support of 99.40. Based on the chart pattern, the US dollar index should have a high possibility to bounce back as long as it is trading above 99.4. On the other hand, the USDX is expected to change the primary uptrend if it broke below 99.40. Technical indicators are signaling a likelihood of a slow climb. MACD started to curve the slop while the RSI is flat above 30.
PIVOT POINT: 99.60
| S1 | S2 | S3 | |
| SUPPORT | 99.40 | 99.10 | 98.90 |
| R1 | R2 | R3 | |
| RESISTANCE | 99.75 | 100.35 | 100.75 |
Euro (EURUSD)
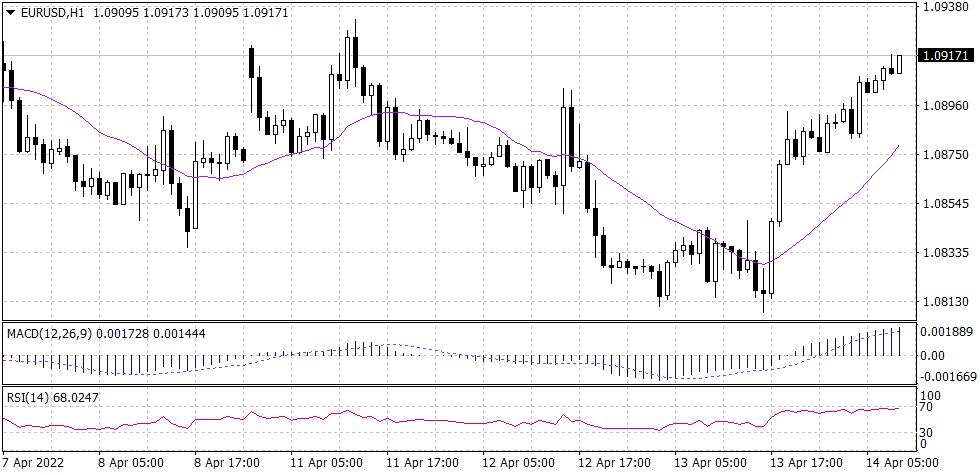
The common currency rose from 1.0815 to 1.0921 as the U.S. dollar weakened. However, these gains are considered a result of a corrective move to soften the long-term downtrend. Technical indicators show a possible swing, MACD started to curve the slop while the RSI is flattening below 70.
PIVOT POINT: 1.0917
| S1 | S2 | S3 | |
| SUPPORT | 1.0900 | 1.0875 | 1.0835 |
| R1 | R2 | R3 | |
| RESISTANCE | 1.0935 | 1.0950 | 1.0110 |
Spot Gold (XAUUSD)
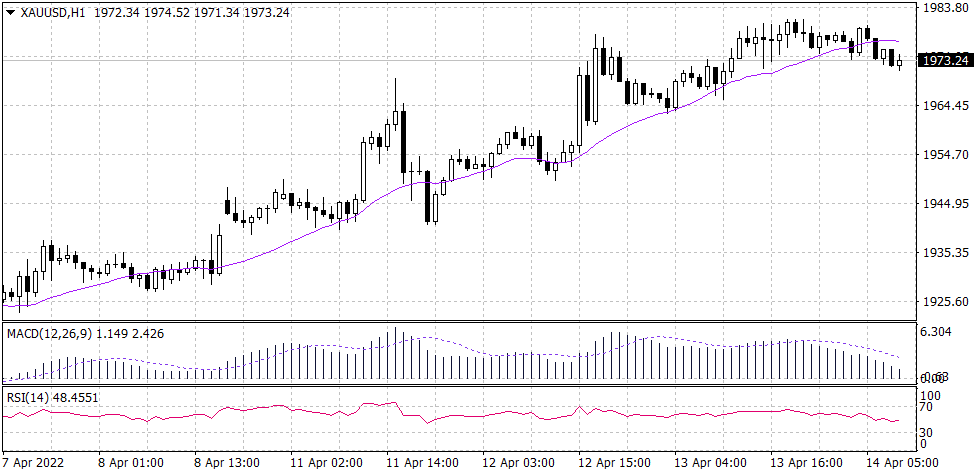
Gold remains in the upward trend that started early this week and is trading in a narrow range during the early trades today. Nonetheless, the precious metal is supported above $1,968 on the intraday time frames. While the 20-period moving average is moving alongside the price line, MACD and RSI are signaling a fluctuation around $1,970.
PIVOT POINT: 1,973
| S1 | S2 | S3 | |
| SUPPORT | 1,970 | 1,965 | 1,960 |
| R1 | R2 | R3 | |
| RESISTANCE | 1,975 | 1,979 | 1,981 |
WTI crude (USOUSD)
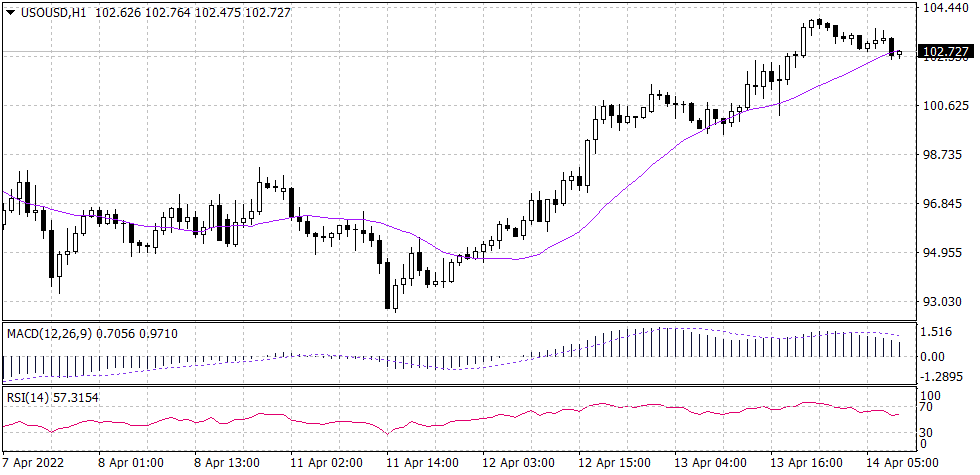
Light crude retains some strength above $100 despite the crude oil supply numbers trading at $102 a barrel. Technically, WTI is expected to bounce back towards $111 unless the prices broke below the support of $100 a barrel. Technical indicators signal a bearish movement targeting $101 a barrel.
PIVOT POINT: 102.70
| S1 | S2 | S3 | |
| SUPPORT | 102.20 | 101.60 | 100.65 |
| R1 | R2 | R3 | |
| RESISTANCE | 103.25 | 104.40 | 108.80 |
Bitcoin (BTCUSD)
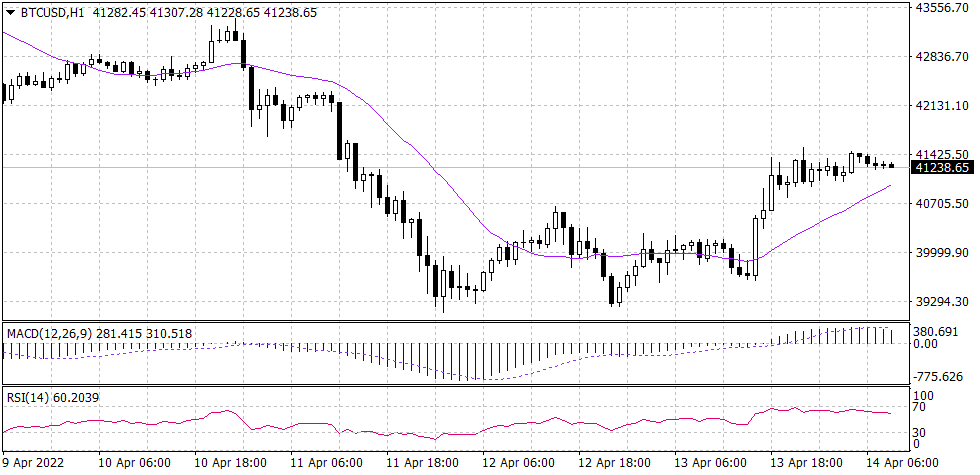
Bitcoin gained from $39,600 to $41,390 fueled by buying activities amid the weakness of the U.S. dollar. Technically, the crypto flagship is unlikely to gain momentum for an uptrend unless it exceeded the resistance of $43,000. Technical indicators show the BTCUSD close to being overbought and signal a possibility of a drop towards 39,600.
PIVOT POINT: 41,240
| S1 | S2 | S3 | |
| SUPPORT | 41,135 | 41,050 | 40,900 |
| R1 | R2 | R3 | |
| RESISTANCE | 41,320 | 41,500 | 42,130 |
