

MARKET NEWS SUMMARY
Euro (EURUSD)
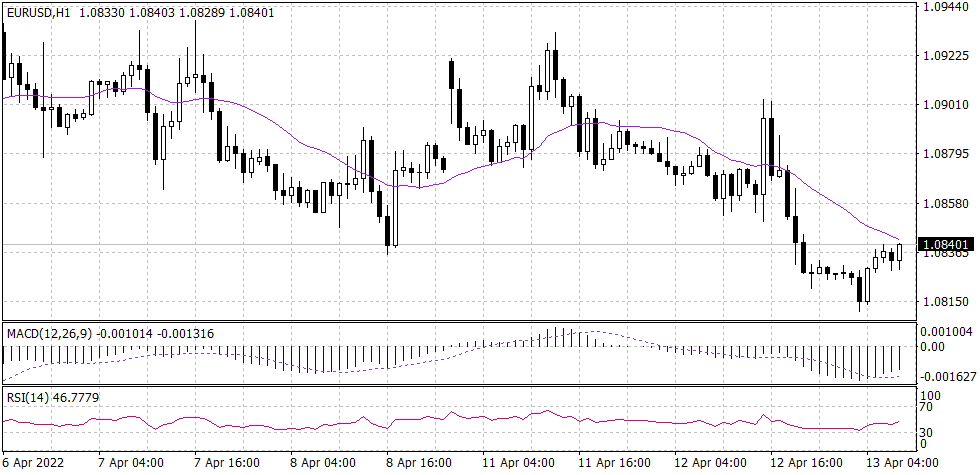
The Euro was dragged down by the heavy selling pressure amid the U.S. inflation data. EURUSD remains red for the ninth consecutive day and is expected to trade lower until the end of this week. However, EURUSD is trading above the light support level of 1.0820 mentioned yesterday, while the hourly chart is showing an intra-day swing during the European session. MACD line changed direction signaling a slight upward movement, while the RSI remains below 50.
PIVOT POINT: 1.0840
| S1 | S2 | S3 | |
| SUPPORT | 1.0820 | 1.0770 | 1.0710 |
| R1 | R2 | R3 | |
| RESISTANCE | 1.0900 | 1.0980 | 1.0110 |
Japanese Yen (USDJPY)
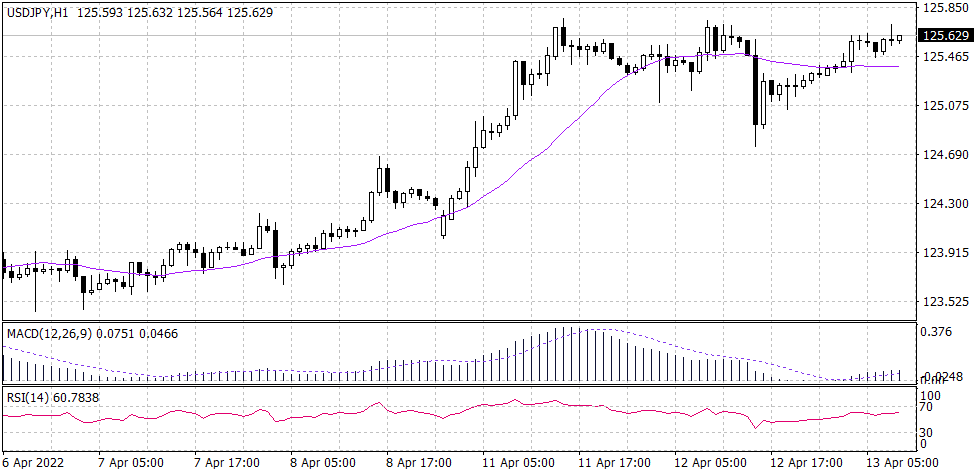
The Japanese Yen holds ground against the greenback after reaching its weakest since 2015. The USDJPY pair has reached the strongest resistance in the current range at 125.70, yet the pair retains a solid uptrend over the daily time frame. While technical indicators do not show any downswing, the RSI is smoothing, which means the pressure is easing and the current slop will remain.
PIVOT POINT: 125.60
| S1 | S2 | S3 | |
| SUPPORT | 125.70 | 125.85 | 126.10 |
| R1 | R2 | R3 | |
| RESISTANCE | 125.45 | 125.10 | 124.85 |
Dow Jones 30 (US30)
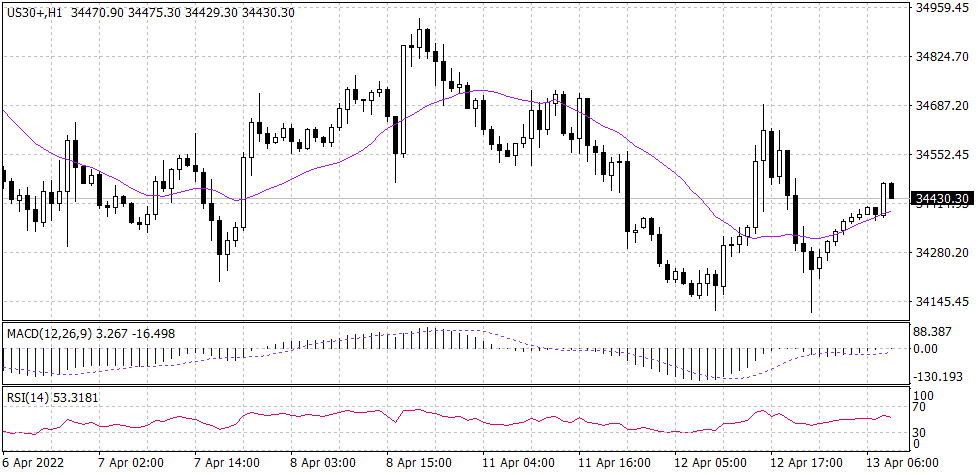
The U.S. blue-chip DJ30 closed red for the second day amid the inflation data. However, the Dow Jones is now near the famous support level of 34,000. The daily chart shows the Dow on a possible drop towards 33,500 if the support level of 34,000 was broken. On the hourly chart, the Down Jones is recording lower tops and moving downwards. Furthermore, the technical indicators are confirming a slow movement towards 34,200.
PIVOT POINT: 34,400
| S1 | S2 | S3 | |
| SUPPORT | 34,300 | 34,200 | 34,000 |
| R1 | R2 | R3 | |
| RESISTANCE | 34,485 | 34,570 | 34,660 |
Spot gold (XAUUSD)
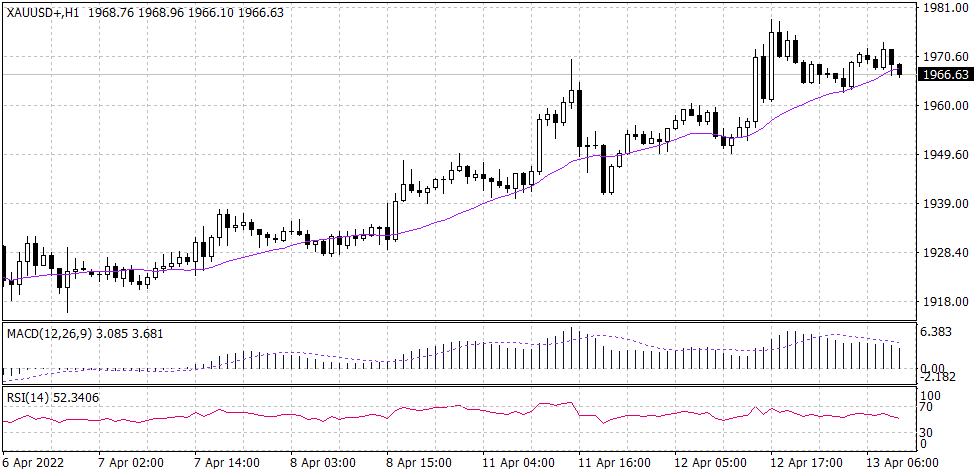
The precious metal closed for seven consecutive days, bouncing from the support at $1,920. On the hourly chart, gold is trading in the range between $1,960 and $1,970. Nevertheless, the RSI is signaling a slow downward movement and indicating a possible swing below $1,965.
PIVOT POINT: 1,965
| S1 | S2 | S3 | |
| SUPPORT | 1,950 | 1,945 | 1,942 |
| R1 | R2 | R3 | |
| RESISTANCE | 1,971 | 1,975 | 1,981 |
Brent crude (UKOUSD)
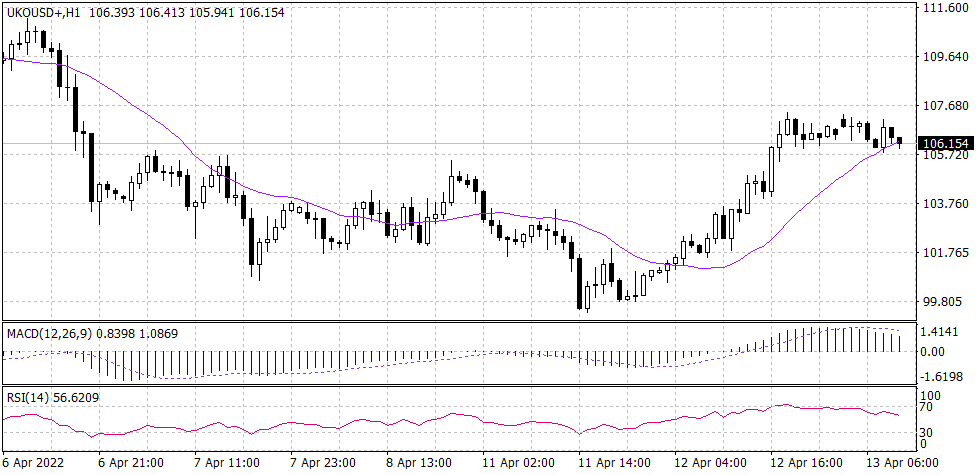
Crude oil prices remain in their downward trend that started on March 24th. Crude oil prices are pressured by geopolitical events and inflation data. Technically, Brent crude traded horizontally during the early session. However, technical indicators do not show any signals of a downward trend. Meanwhile, the heavy crude is trading below the 20 candles moving average, while the RSI and MACD signal further drop.
PIVOT POINT: 106.20
| S1 | S2 | S3 | |
| SUPPORT | 105.70 | 104.10 | 103.00 |
| R1 | R2 | R3 | |
| RESISTANCE | 107.00 | 107.70 | 108.80 |
